3-42 | Model 933 UV Analyzer
4. The sample gas should be flowing through the analyzer and periodi-
cally, approximately every 120 seconds (default setting), should be
switching the two columns. The graph on the computer screen being
displayed should resemble one of the three graphs in Figure 3-20. Im-
mediately after a column switch, the real-time concentrations of H
2
S,
COS, and MeSH should drop.
After a short time delay (usually 10–20 seconds) the concentration of
H
2
S should start to increase. This is the onset of H
2
S elution from the
column. A few seconds later, COS should also begin to elute from the
column. The concentrations should then stabilize into a plateau.
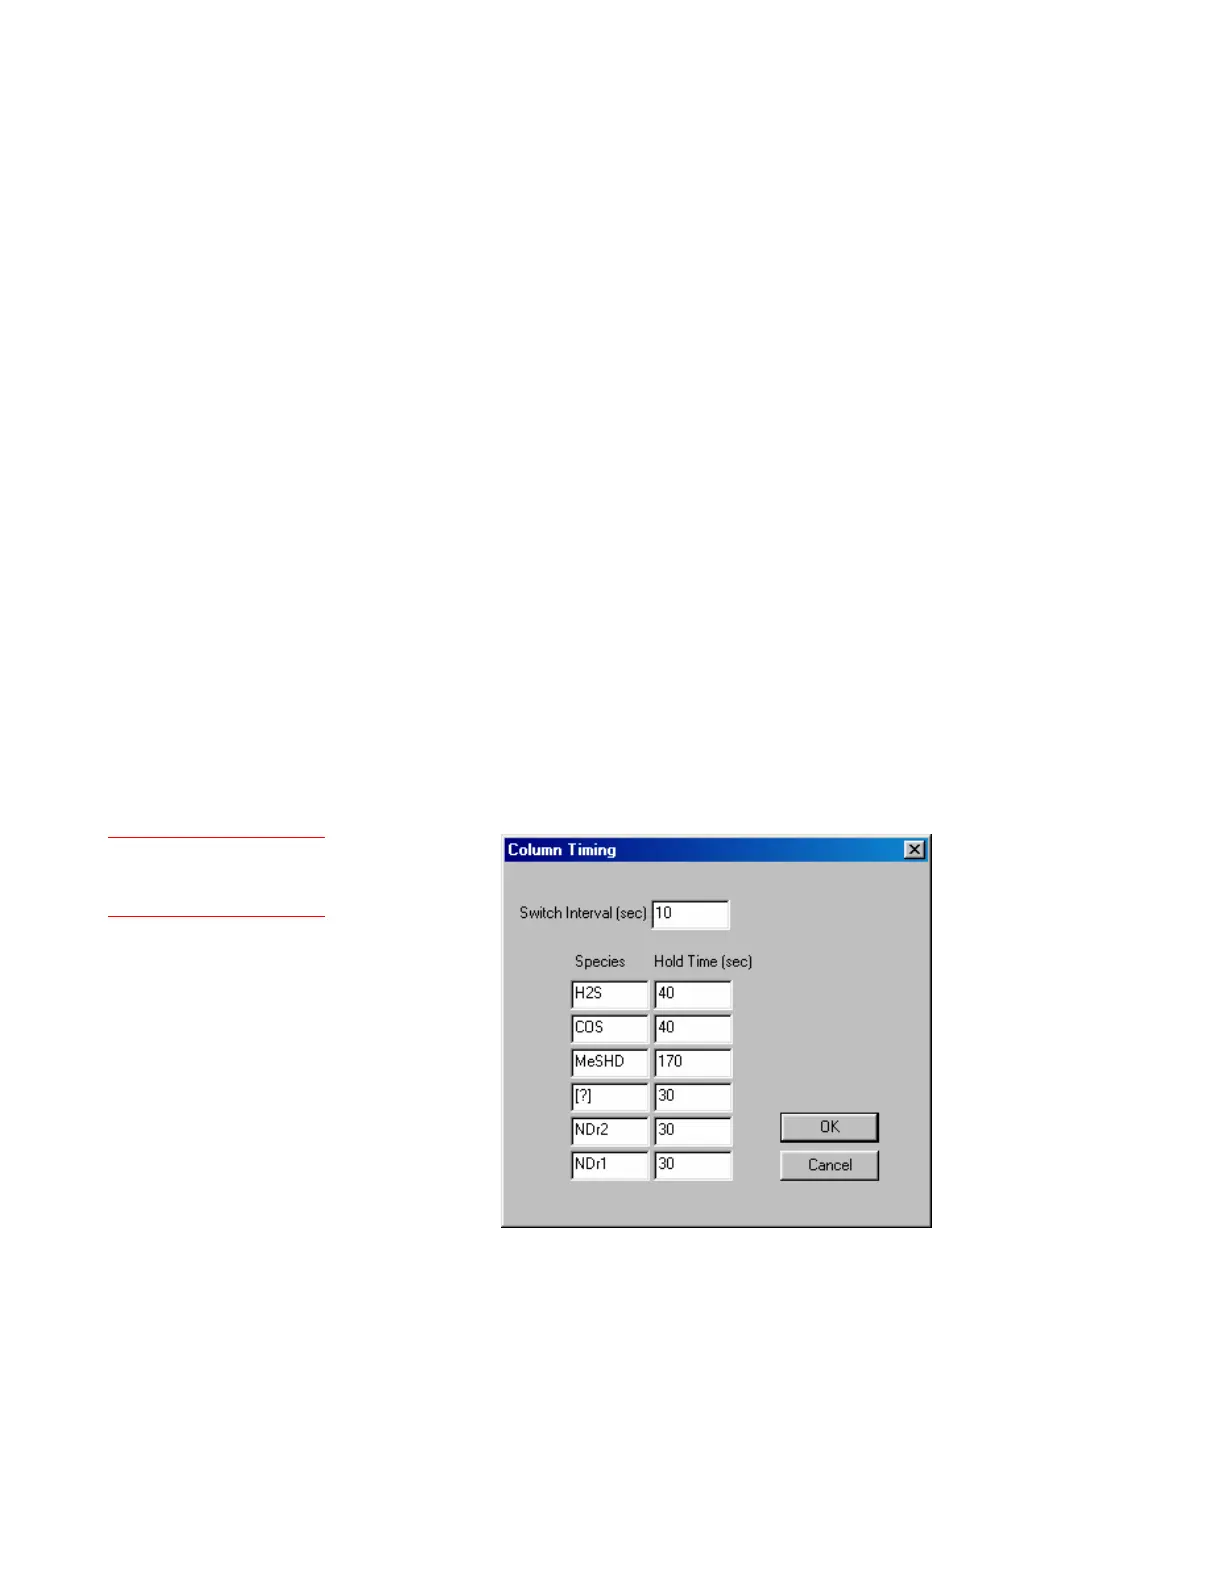
Eventually, if the Switch Interval (Figure 3-21) is sufficiently long, the
MeSH will elute and also plateau. Typically, EtSH elution may begin
soon after (10–30 seconds) the MeSH stabilizes into a plateau.
5. Look at the graph of the concentrations being displayed and compare
it to the top graph in Figure 3-20. The column should be switching
before EtSH begins to elute. The EtSH elution time can be recognized
as the point after H
2
S, COS, and MeSH have all stabilized and where
H
2
S begins to drop and COS and MeSH begin to increase. If it appears
that EtSH is eluting, the Switch Interval is too long.
To change the Switch Interval, view the Column Timing dialog
box and enter a new time. Click OK then Apply. Save the change to
EEPROM.
Figure 3-21.
Column Timing dialog
box.
Setup (tab)
Column Timing