Page 86
Operation
thermoMETER CTL
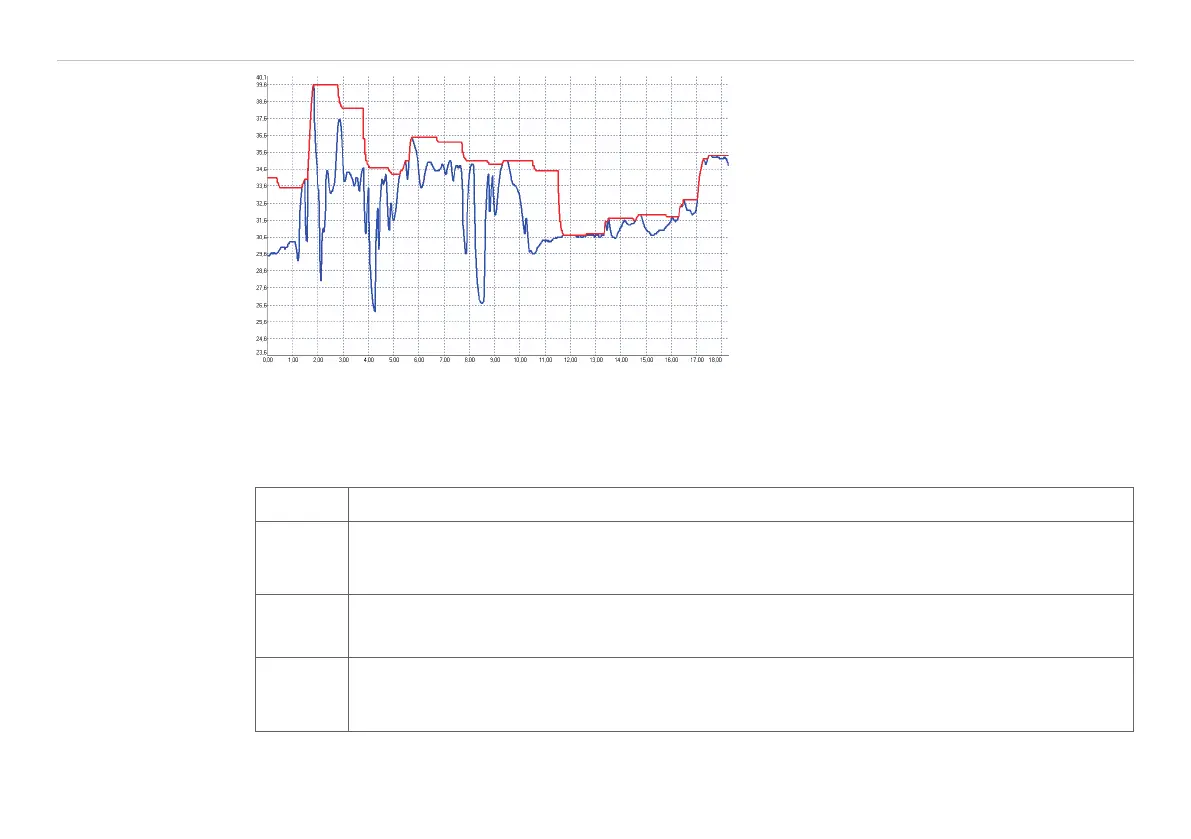
Fig. 31 Signal graph with P----
Red graph: TProcess with Peak Hold (Hold time = 1 s)
Blue graph: TActual without post processing
Display Description
u 0.0 Setup of the lower limit of temperature range. The minimum difference between lower and up-
per limit is 20 K. If you set the lower limit to a value ≥ upper limit, the upper limit will be adjust-
ed to [lower limit + 20 K] automatically.
n 500.0 Setup of the upper limit of the temperature range. The minimum difference between upper and
lower limit is 20 K. The upper limit can only be set to a value = lower limit +20 K.
[ 0.00 Setup of the lower limit of the signal output. This setting allows an assignment of a certain sig-
nal output level to the lower limit of the temperature range. The adjustment range corresponds
to the selected output mode (e.g. 0 - 5 V).