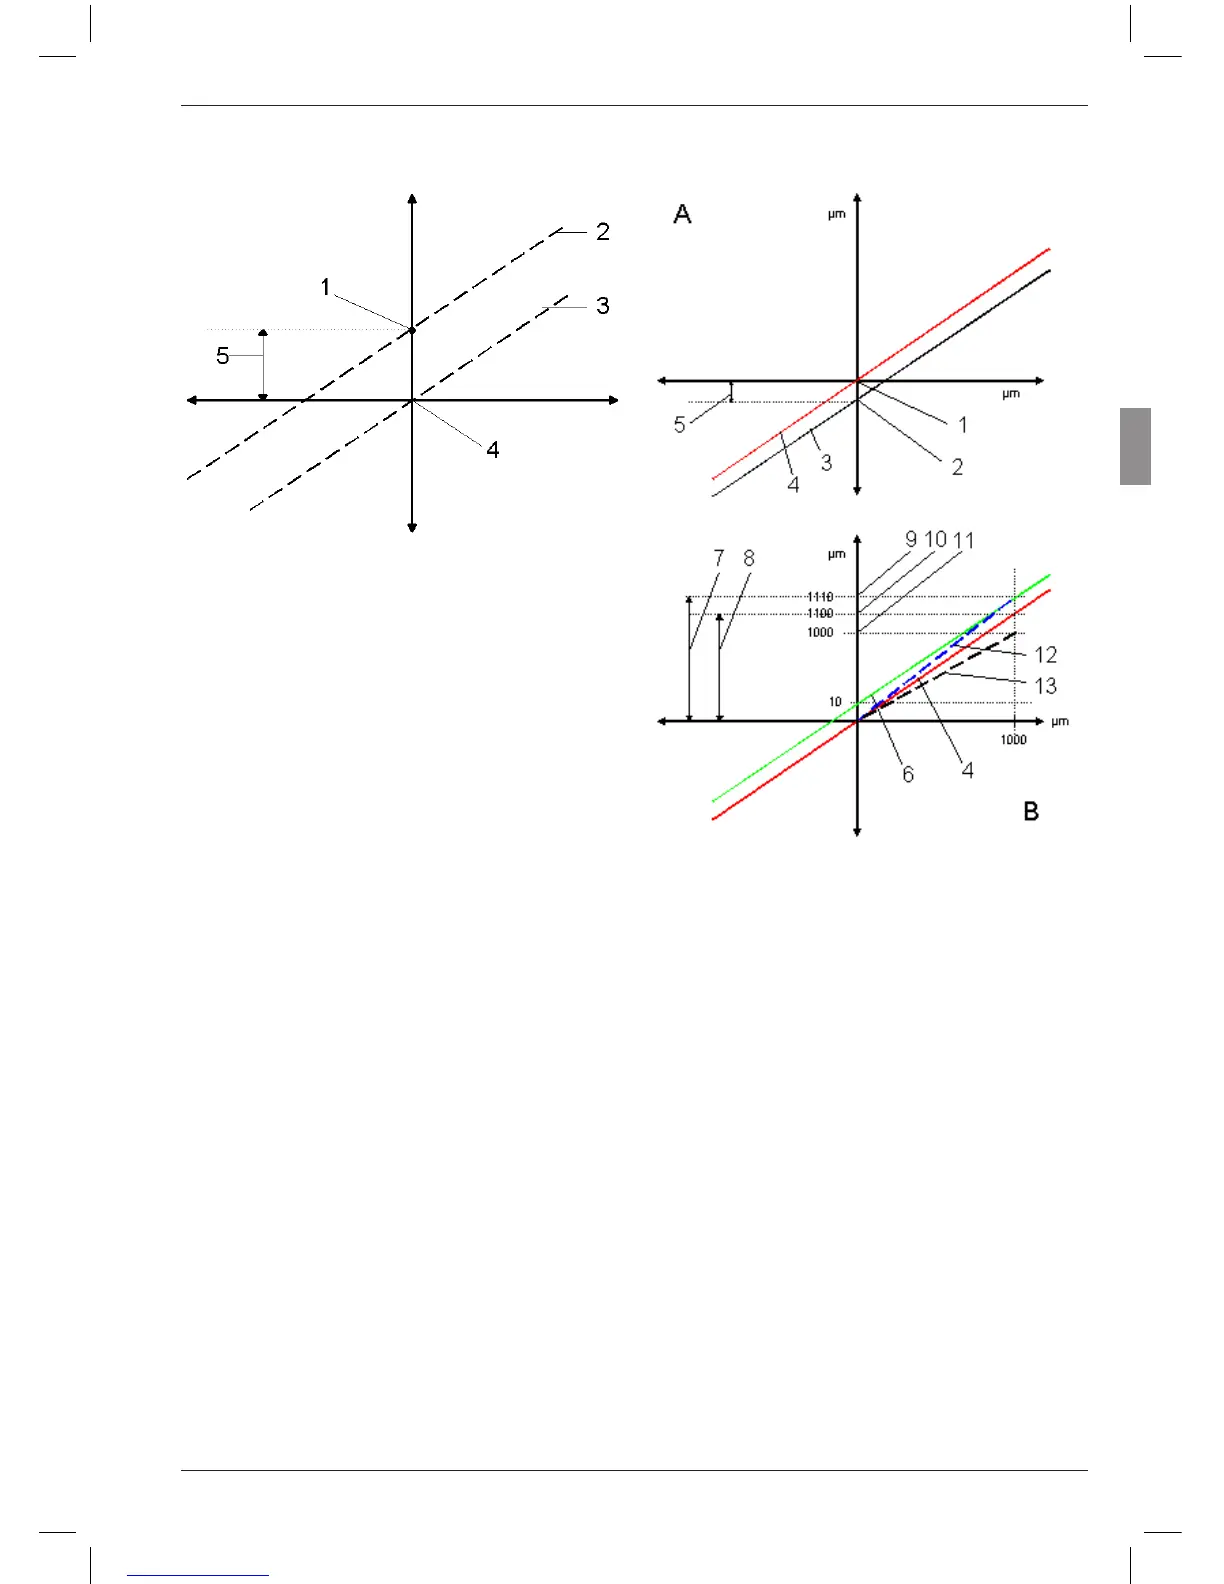
Fig. 3
Shifting the probe’s characteristic curve in the
display range
1 Assessed master actual value
2 Computed situation of the probe’s charac-
teristic curve
3 Corrected situation of the probe’s charac-
teristic curve based the master measure-
ment
4 Master nominal value
5 Deviation between the master actual and
nominal values
Fig. 4
Shifting the probe’s characteristic curve (A)
and (B) correcting its slope
1 Nominal value of MSTR.MIN
2 Actual value of MSTR.MIN
3 Computed situation of the curve
4 Corrected situation of the curve after the
MSTR.MIN measurement
5 Deviation between the nominal and actual
value of the MSTR.MIN measurement
6 Parallel shift of the curve such that it runs
through the MSTR.MAX actual value
7 MSTR.MAX – MSTR.MIN (absolute value)
8 MSTR.MAX – MSTR.MIN as a relative value
(i.e. when considering the linear error)
9 Actual value of MSTR.MAX
10 Actual value of MSTR.MAX when consider-
ing the linear error
11 Nominal value of MSTR.MAX
12 Actual slope of the curve
13 Slope of the probe’s characteristic curve re-
quired for obtaining correct values
Indication value
Probe value