5-34 Image Optimization
5.9.4.1 TDI QA Screen Description
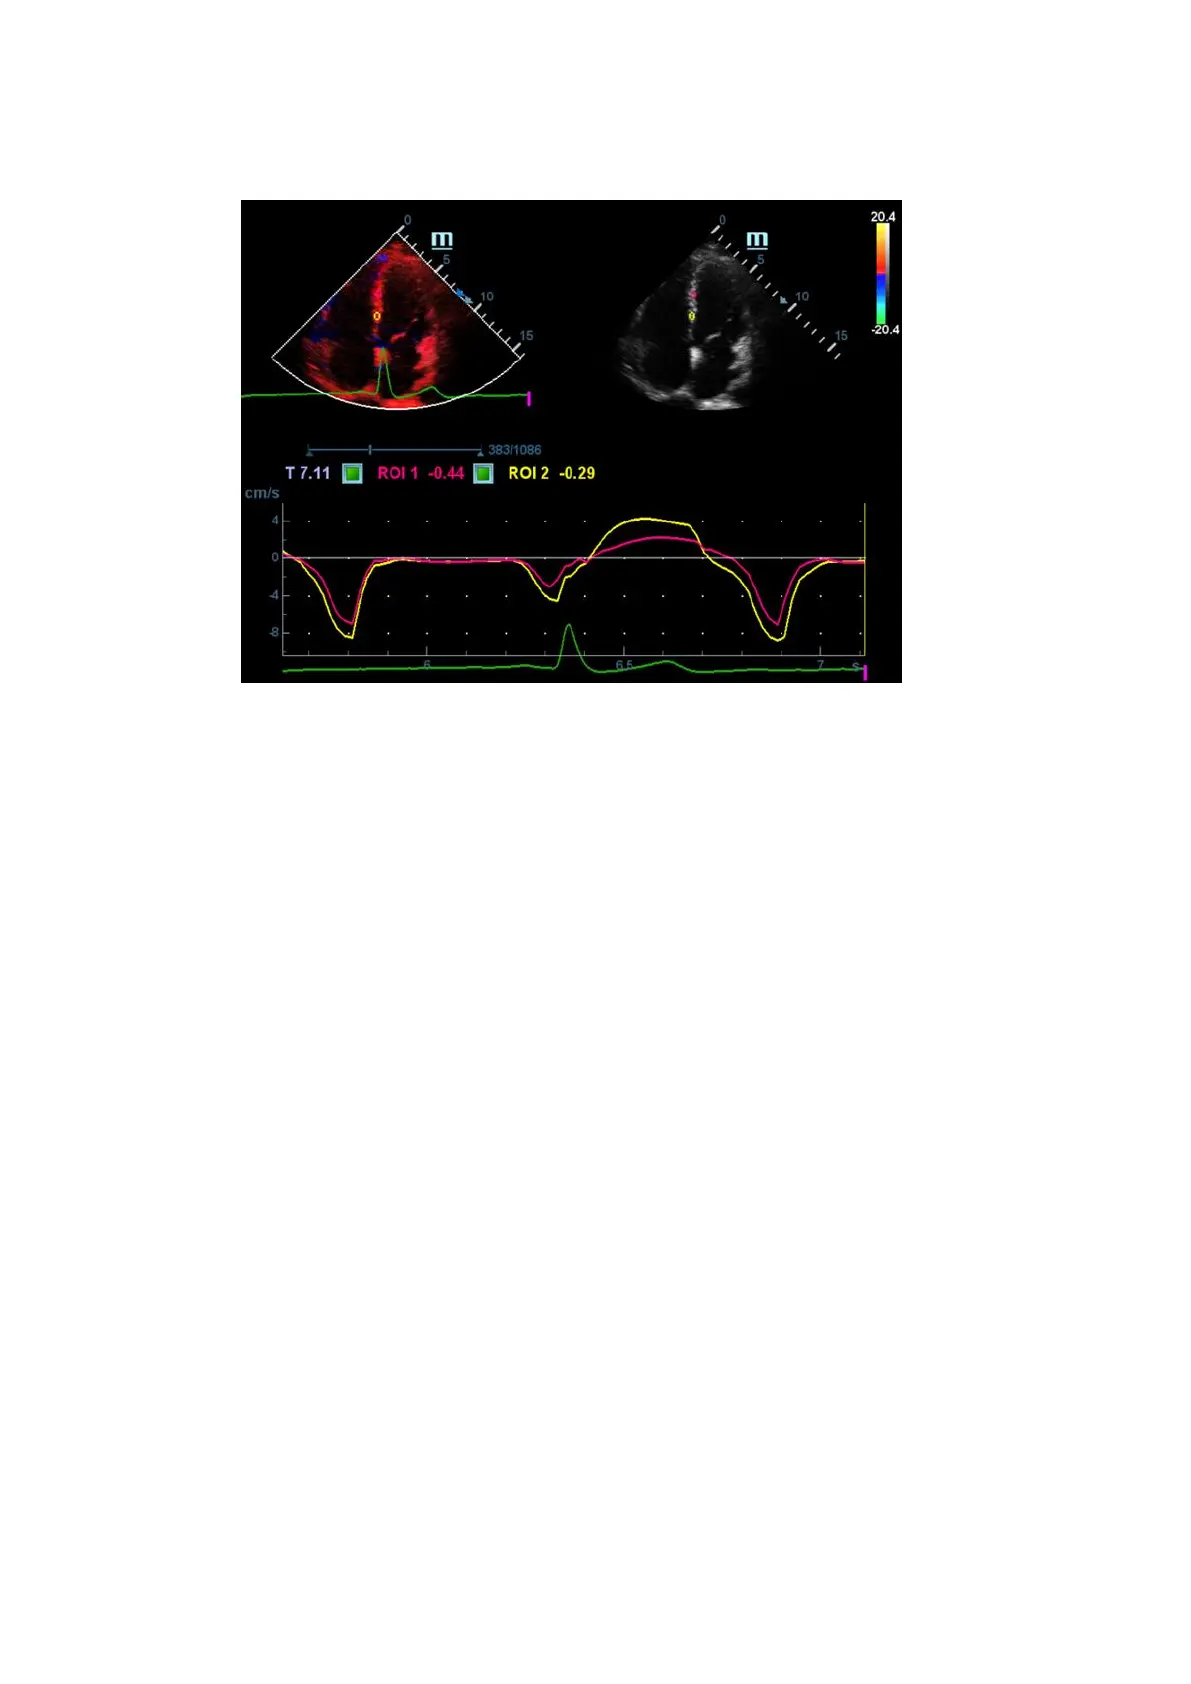
TDI QA Screen (take Speed – Time curve as an example)
1---TVI Cineloop window
Sample area: indicates sampling position of the analysis curve. The sample area is color-coded, 8
(maximum) sample areas can be indicated.
2---B Cineloop window
Tips:
Images in the TVI cineloop window and B cineloop window are the frozen image of the
same moment; roll the trackball to review the images in the two cineloop windows.
Sample areas are linked in the TVI cineloop window and B cineloop window.
3---Displays analysis curve
Y axis represents the speed (unit: cm/s). [In Strain Rate – Time curve, Y axis represents
strain rate (1/s). In Strain – Time curve, Y axis represents strain (%).]
while X axis represents the time (unit: s).
Frame marker: a white line that perpendicular to the X axis, can be moved horizontally left
to right (right to left) by rolling the trackball.
Click the check box beside the ROI to set if to hide or to display the QA curve.
You can get the current X/Y axis value by moving the cursor onto one point on the curve;
and if you press <Set> at this time, the frame marker will move to the spot.
4---Displays ECG trace (no ECG trace displayed here).
5.9.4.2 Basic Procedures of TDI QA
QA Analysis Image Range
The system set the starting time and ending time of the cine to be first frame and last frame of QA
analysis range.
Setting ROI
This function is used for setting the TDI QA target.