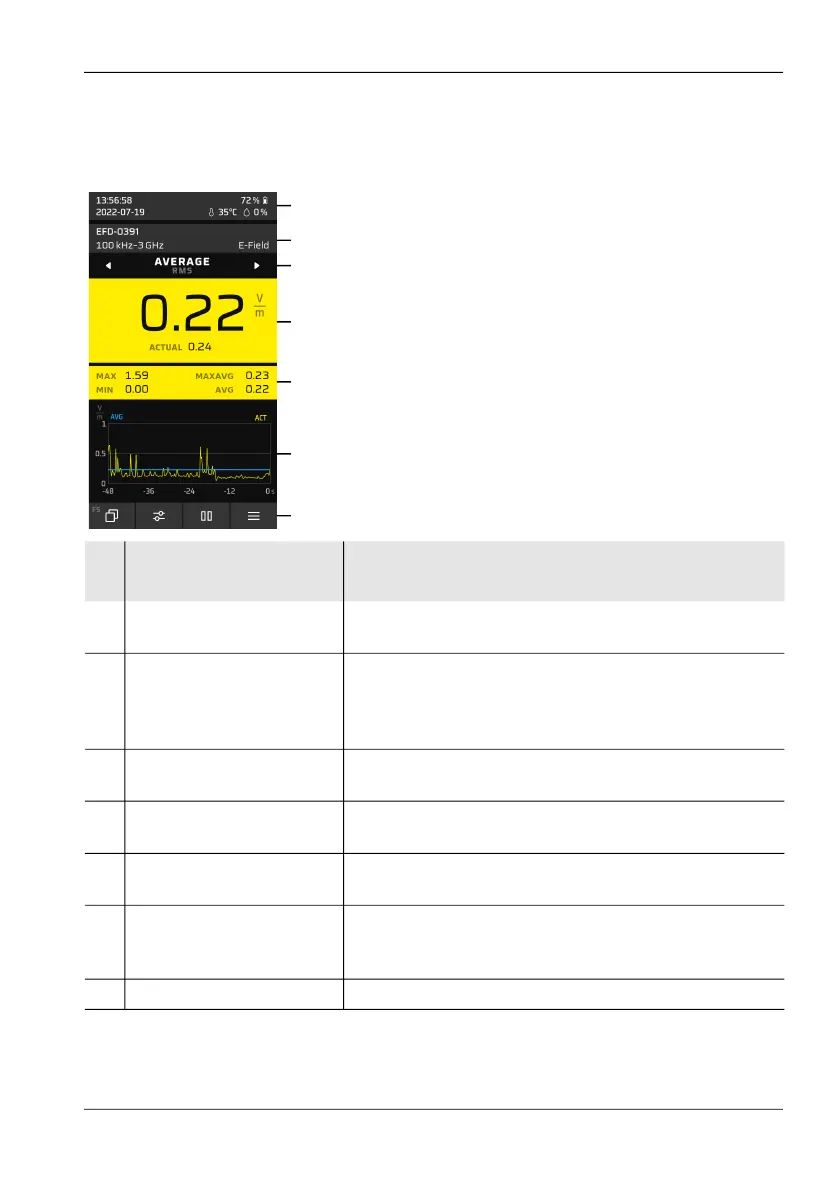
5.3 Display overview
Narda FieldMan 33
5.3 Display overview
The display is divided into different display areas:
No. Area Description
1 Status bar Time, alarm, GPS, BT, WiFi, charge status, mute,
date, air temperature, humidity, distance meter
2 Probe information Probe model, charge status, correction frequency, fre-
quency range/span, field type, filter setting, pulse de-
tection (Pulse Detection = On, short integration time
e.g. for radar signals)
3 Information about the
measured values
Result type, detector
4 Main display of the mea-
sured values
Isotropic measured value (RSS) and measuring unit,
measured values for spatial axes (if available)
5 Additional display of the
measured values
Statistical measured values over the entire period of
the measurement, depending on the operating mode
6 Measurement sequence
or measurement graphic
Graphical display of measured values in the time or
frequency range, bar display, or information on the
measurement process
7 Function keys (softkeys) SK1 – SK4
1
2
3
4
5
6
7