BTS User Manual
Neware Technology Ltd.
http://www.newarebattery.com
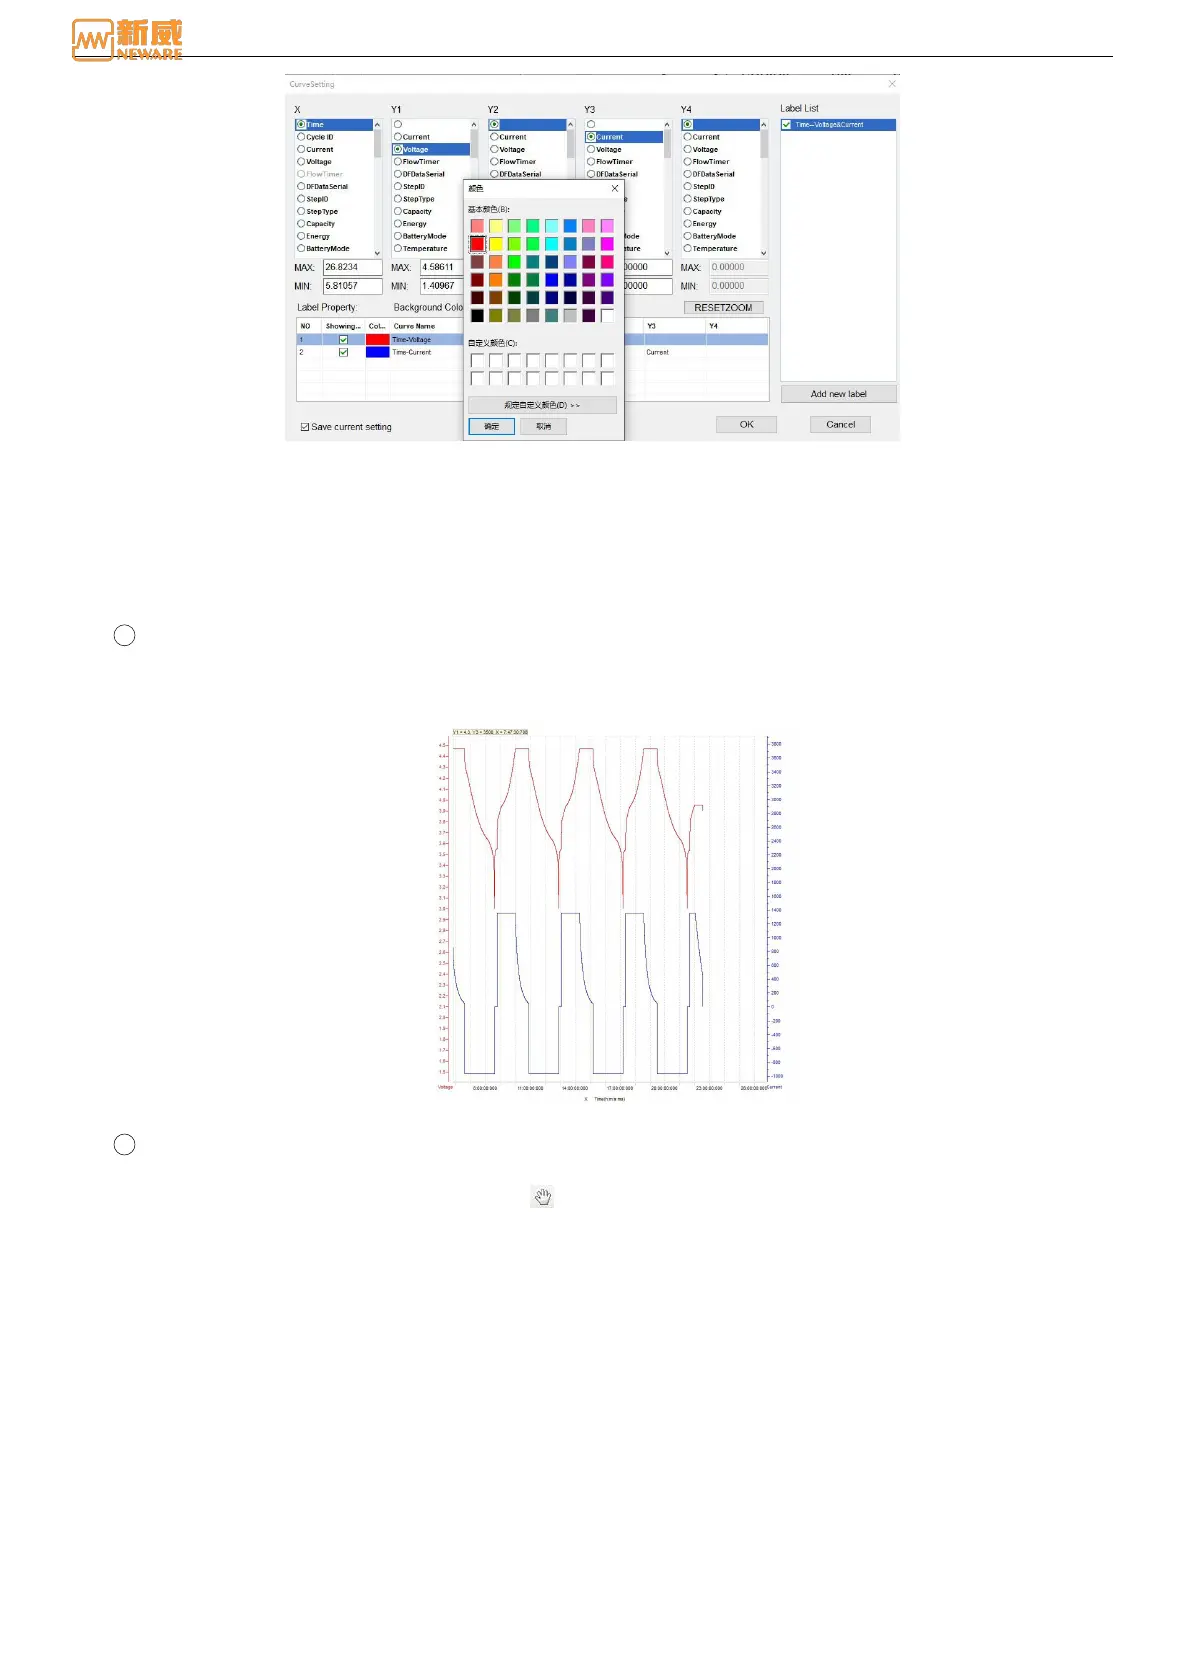
Figure 6-12 Curve setting
2. Curve
The point information on the curve is loaded layer by layer. After the point information for the first layer is obtained,
the point information is loaded layer by layer in the background thread. At the same time, the customer can view the
data of the current loaded layer and perform other operations.
There is a one-to-one correspondence between the recorded data in the curve area and the data area. Double-click the
curve/data to realize the corresponding display of data/curve. See association positioning.
1 The mouse tracking
When the mouse is placed inside the graph area, a yellow strip box will appear above the graph to display the
value of the X and Y coordinate axes at the position of the mouse. Coordinate values change as the mouse moves.
As shown below:
Figure 6-13 XYZ display
2 Curvilinear translation
Use“Hand tool”
Click the hand-shaped icon in the toolbar , The marker changes into the shape of a hand. Hold down the left
mouse button in the graphics area and drag the mouse to move the curve up, down, left and right.
Move the scale on the axes
Place the mouse over the scale on the X/Y axis and change it into the shape of your hand. Hold down the left
mouse button and drag up and down or left and right to move the curve along the scale of the coordinate axis,
as shown in the figure below. The light gray area is the X-axis left and right movement area. When the mouse
is placed on this area, it will change into the shape of a "hand shape + left and right arrow".
In Figure 6-15, the light red and mauve areas on both sides of the Y axis are the up and down control areas of
the Y axis. When you move the mouse over this area, it changes to the "hand shape + up and down arrow"
shape. Hold down the left mouse button to drag the Y axis up and down.