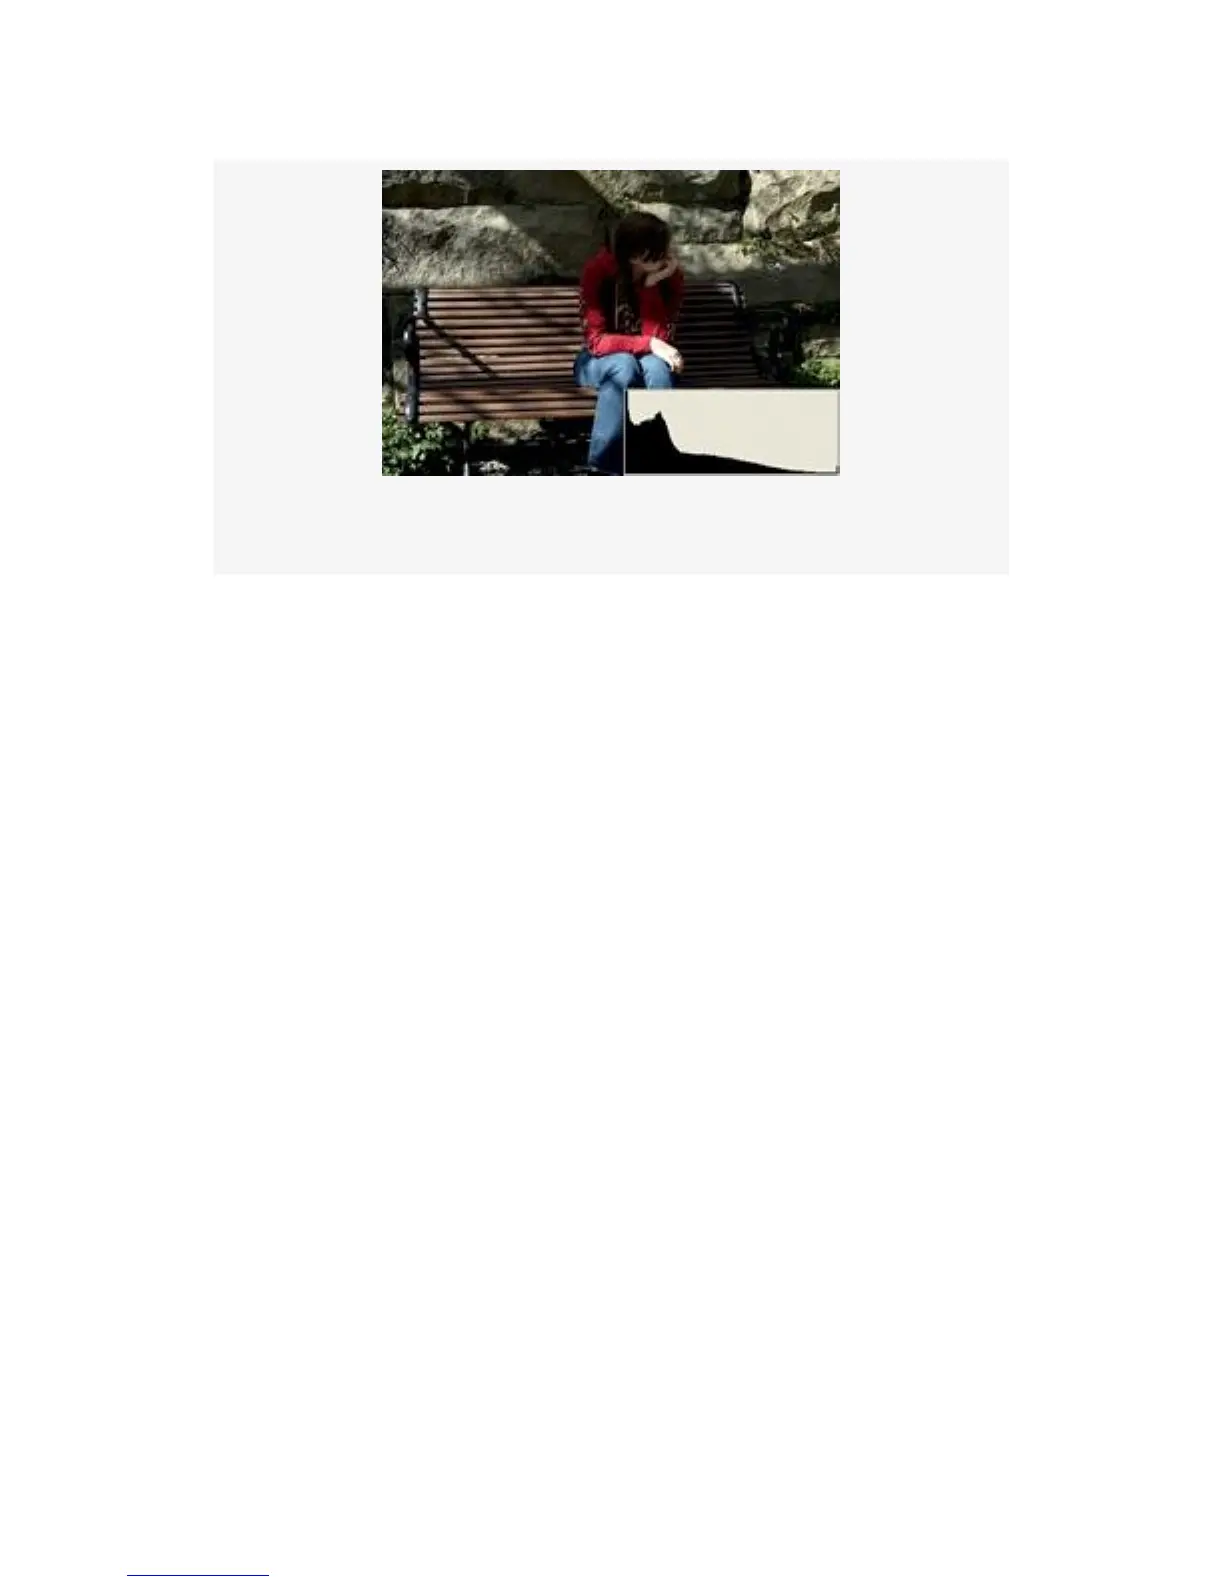
Figure 9-17. Histogram showing underexposure (dark side)
The most important thing to understand when you see a
histogram like the one in Figure 9-17, with part of the peak
clipped off on the left, is that some or all of the image is
significantly underexposed.
Now look at a similar image in Figure 9-18. In this image, a
larger aperture was used and more light was allowed in. We
can now see much more detail. However, once again, the
range of light is too great for the sensor, so it is now clipped
off on the highlight side (right). The dark-side value is not
clipped; instead, the graph extends to the left dark-side edge
but stops there.
The image in Figure 9-18 shows more detail but is not
professional looking and will win no awards. The range of
light is simply too great to be recorded fully. Many of the
details are overly light, and that can be seen by the clipping of
the histogram on the right side. The most important thing to
remember here is that when you see a histogram graph that is
crammed all the way to the right and clipped, some or all of
the image is significantly too light. Overall, a great deal of the
664