49
7. Use the DOBLE UP and DOUBLE DOWN arrows (1 in Figure 59 c) to scroll more quickly the
measurement list.
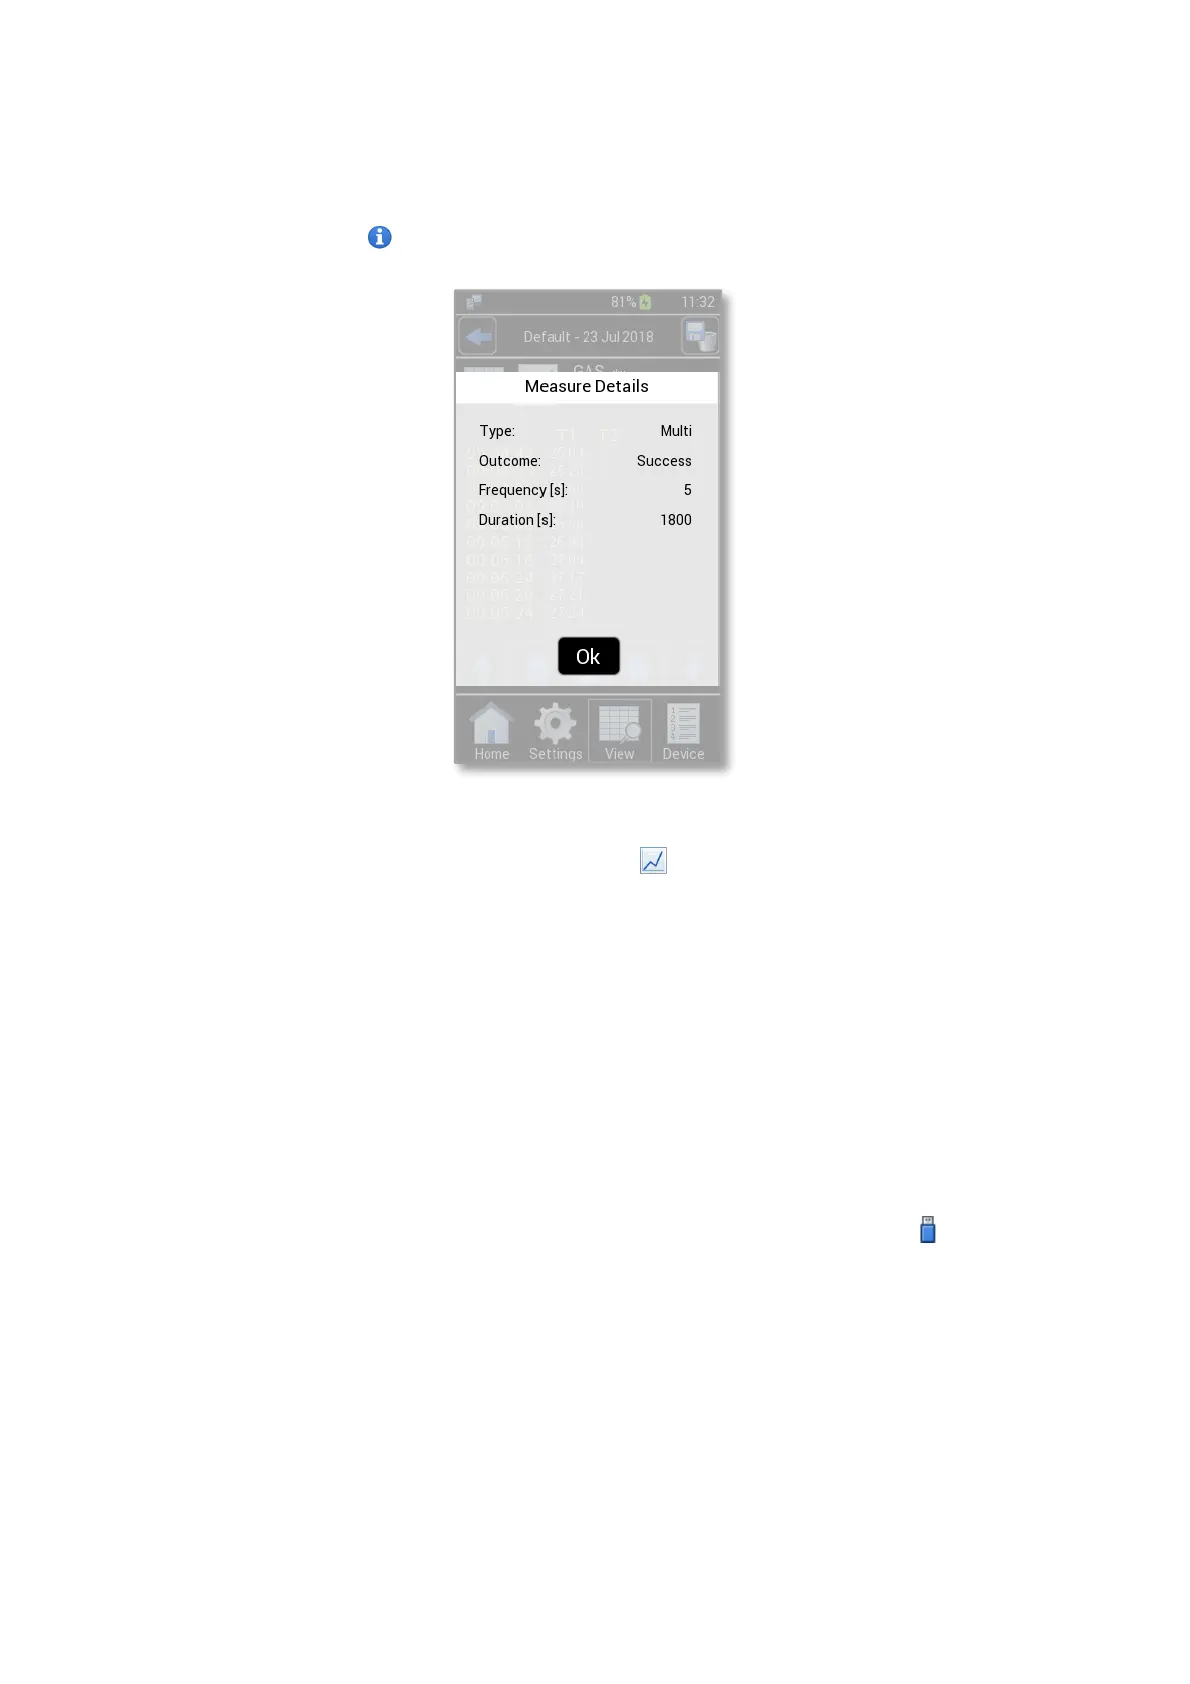
8. Press the Info icon (2 in Figure 59 c) to display the measure’s details (see Figure 61)
Figure 61. Measure details
Tip ► To view the data in graph format, press on icon (3 in Figure 59 c).
If you have inserted the alarm values in the relative page before starting the measurement (see paragraph
9.3.4), they are shown in the top right of the page (4 in Figure 59 c). In the example reported in Figure 59 c, the
CO2 alarm parameters, set before starting the measurement, are 1.0 as CO2 minimum (Min) and 7.2 as CO2
maximum (Max) values.
12.2 Downloading Data
LEO is equipped with local memory to store sensor modules’ readings. These data can be downloaded on
a USB flash drive on user request. To download the stored data of all devices, stored in a precise time interval,
follow the instructions below:
1. Connect the USB key to the MINI-USB port as shown in Figure 62. The Usb Icon appears on the
Homepage (1 in Figure 63).