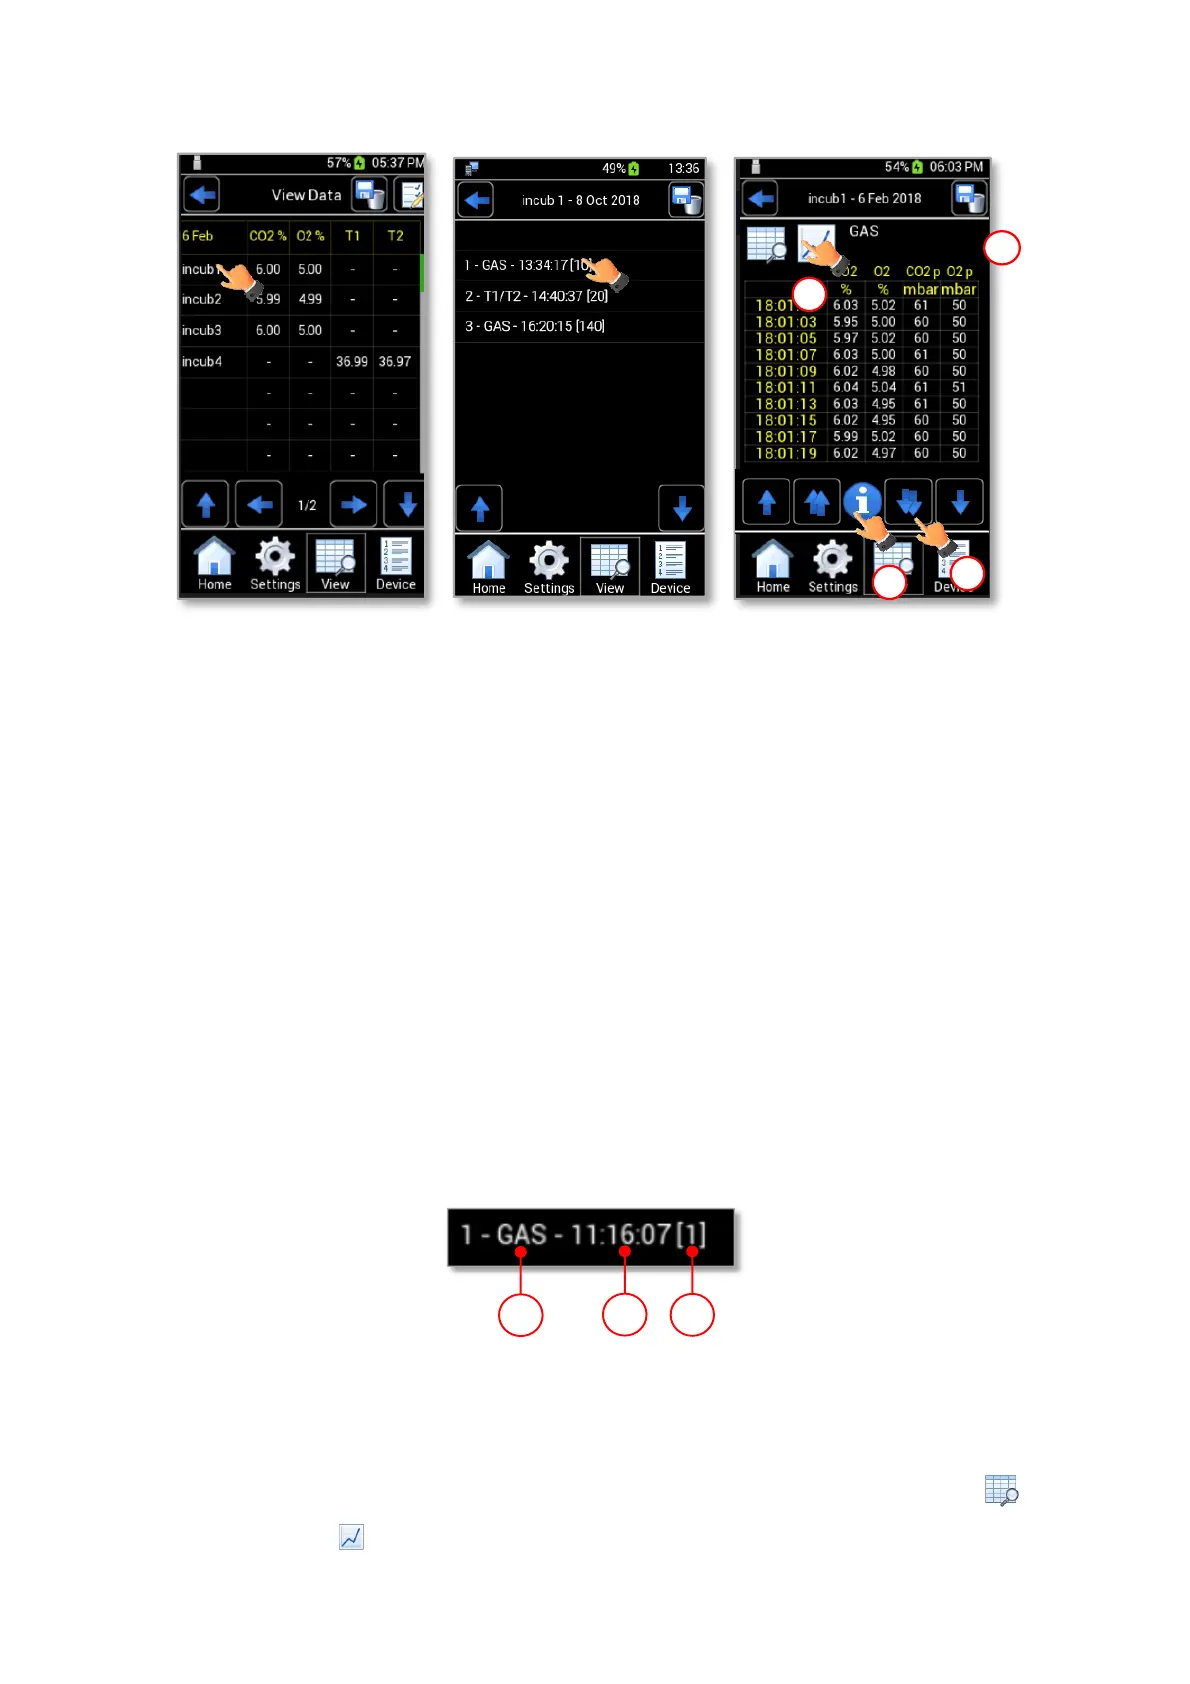
Figure 59. View Data (a – b – c).
Each line corresponds to a reading and the reading type is identified by the prefix (1 in Figure 60):
• GAS, if the reading refers to a CO2-O2 gas concentration measurement.
• T1/T2, if the reading refers to a temperature measurement with T1 and/or T2-MODULE (only if
you used a T1 and or T2-MODULE purchased separately).
In addition to the measurement type, LEO also shows the number of the measurements (3 in Figure 60)
for each measurement.
The number of the measurements depends on whether you started a single point measurement or a
gas/temperature logging:
• For single point measurement, LEO shows [1] (3 in Figure 60) and the time when the
measurement is over (2 in Figure 60)
• For a gas/temperature logging, LEO shows a number that depends on the values inserted for Each
and For parameters before starting the measurement (see paragraph 10.1.4 and 11.3) and
measurement start time.
Figure 60. Data stored format.
6. To display measurement details, press on a line (see Figure 59 b). The page shown in Figure 59 c
opens. If data refer to a gas or temperature logging, they can be seen both in table format and in
graph format .