CP TD1 Reference Manual V 1.44
104
7.8 Interpretation of Measurement Results
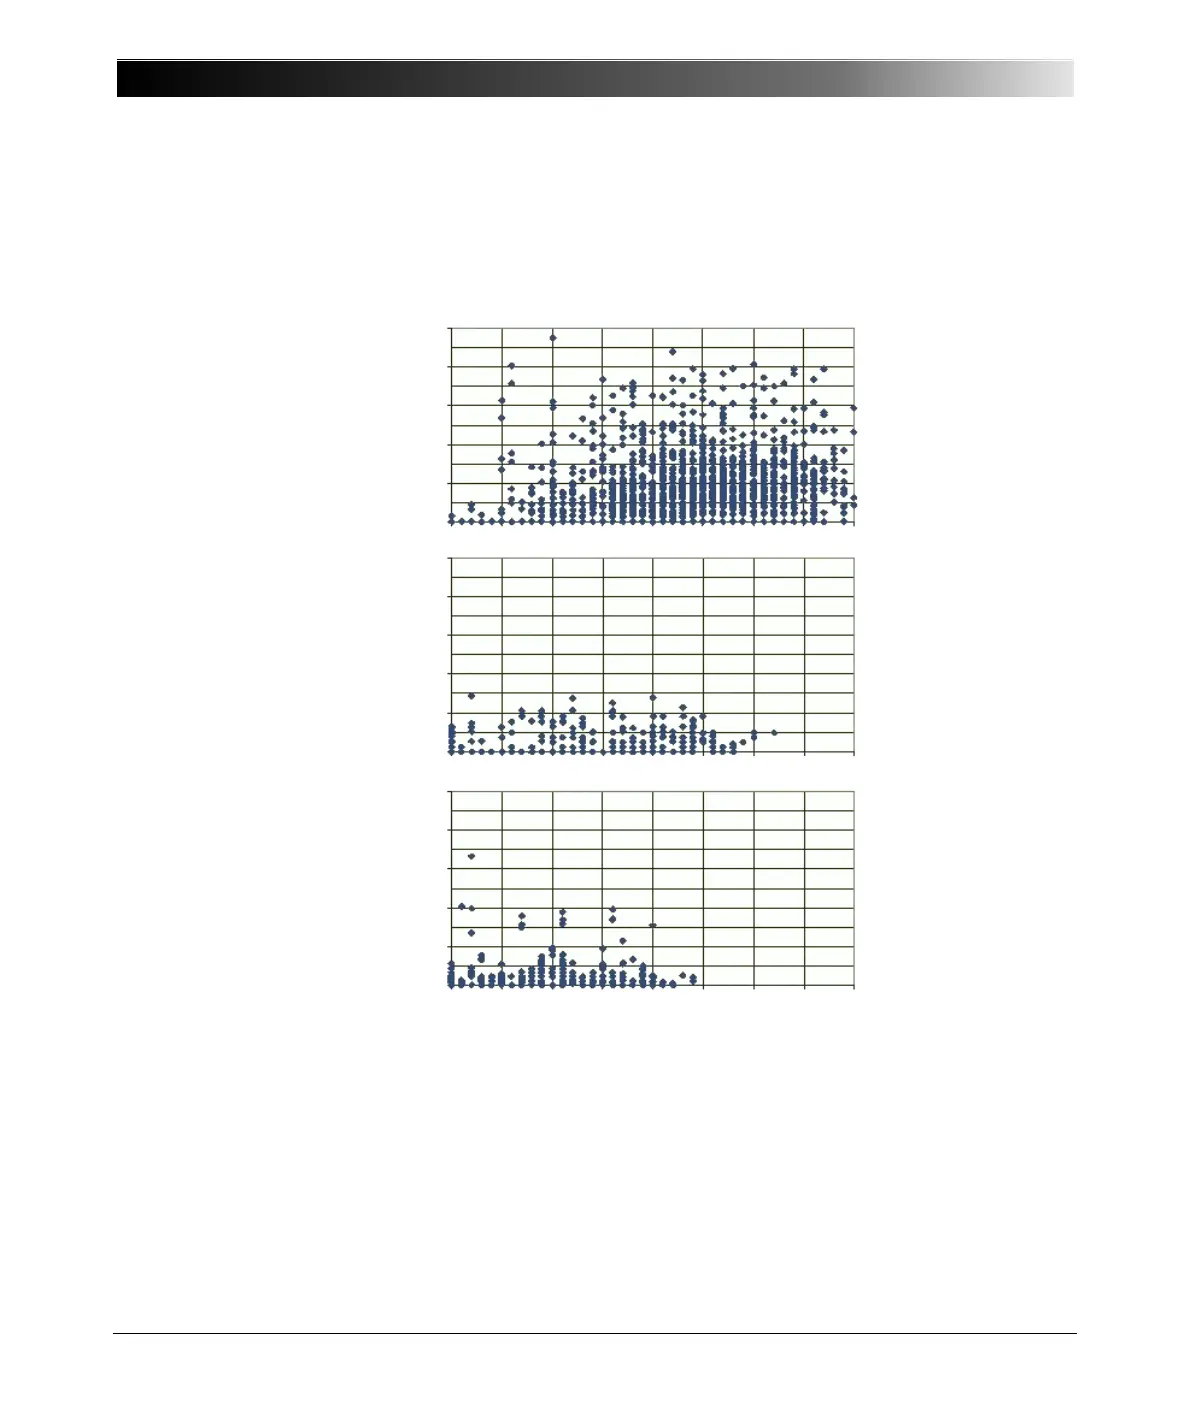
In the appendix typical DF values and limits are listed. Figures 7-11 and 7-12
show the aging of RBP, RIP and OIP bushings [4.5].
Figure 7-11 Aging of RBP, RIP and OIP bushings (change of capacitance)
10
8
6
4
2
0
10
8
6
4
2
0
10
8
6
4
2
0
0 5 10 1520 2530 3540 years
C-change in % RBPC-change in % OIPC-change in % RIP
 Loading...