Identified Satellite Signal Strengths: Bar graphs for all satellites detected. Color
indicates signal strength.
With your mouse pointer, hover over a bar graph to display tool tip information about
satellite constellation, satellite number, and signal strength.
Letter Symbol GNSS Constellation
G GPS
R GLONASS
E Galileo
J QZSS
C BeiDou
I IRNSS
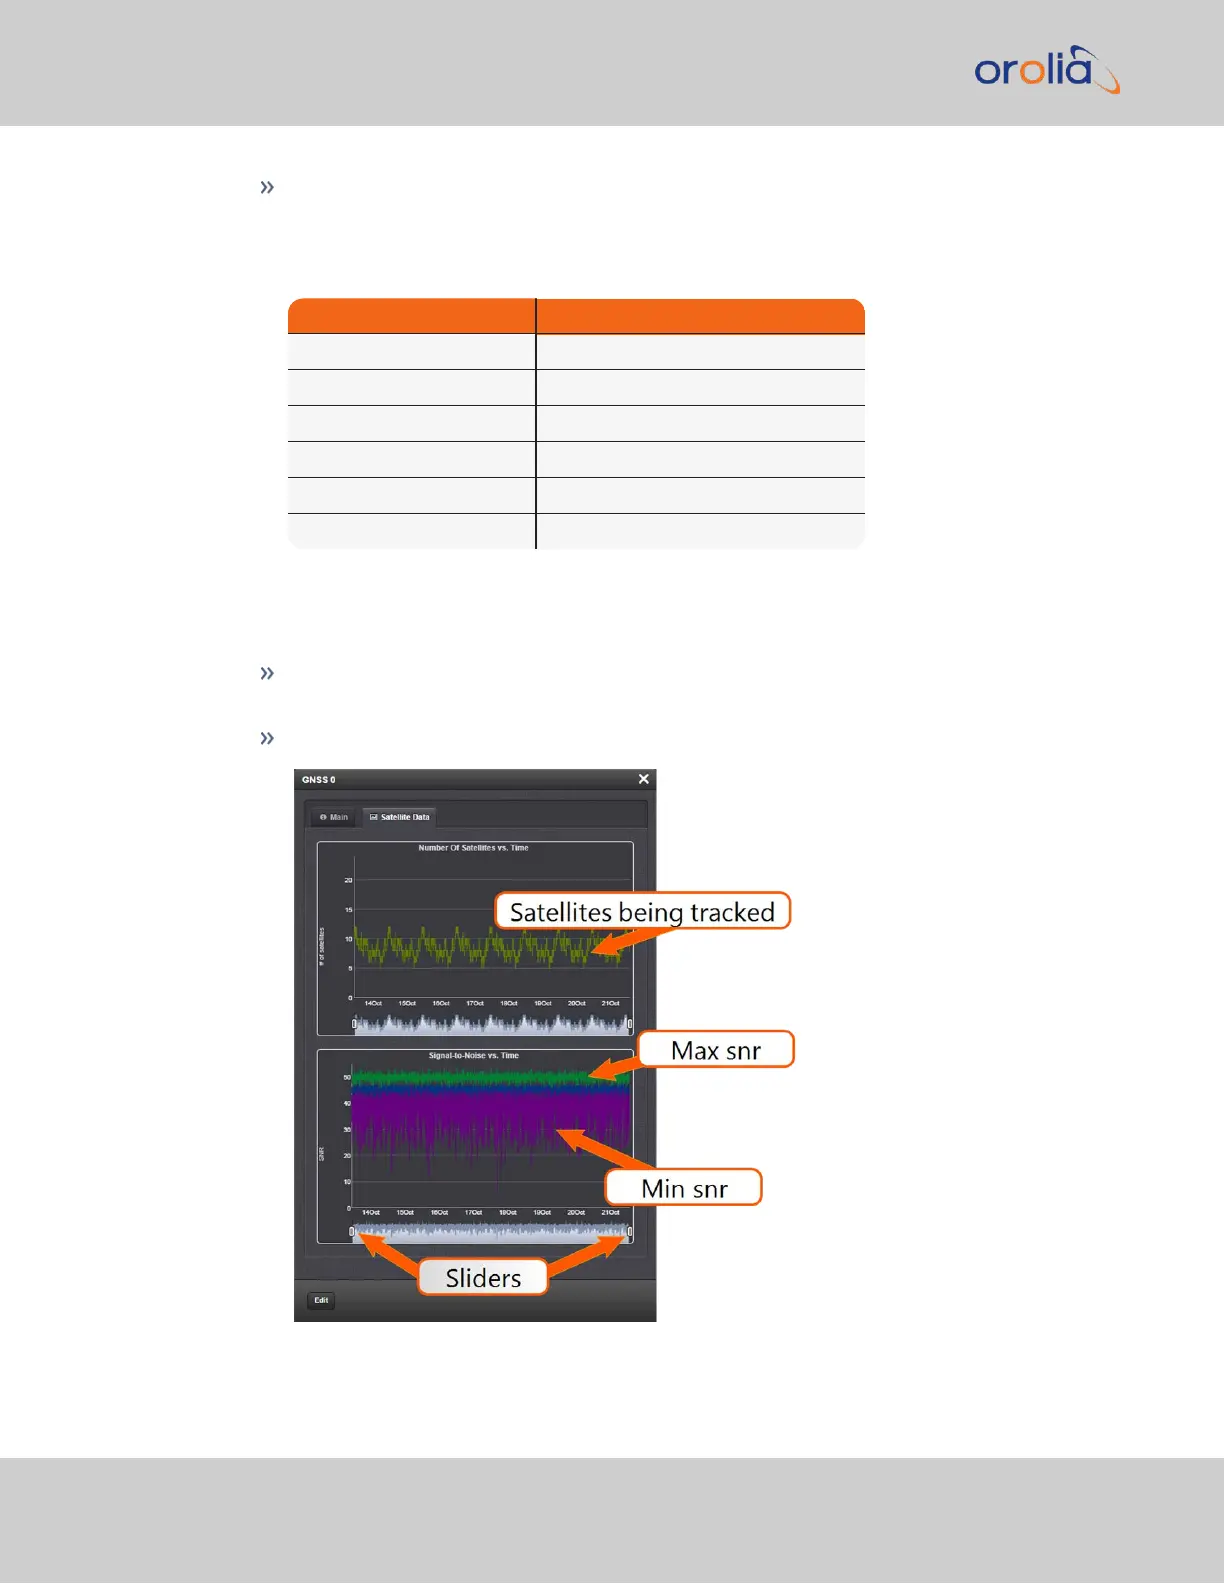
The "Satellite Data" tab
Under the Satellite Data tab, there are two graphs:
Number of Satellites over Time: A graphical track of how many satellites were
being tracked over time.
SNR over Time: A graphical track of maximum SNR, and minimum SNR.
176
CHAPTER 3 • VersaSync User Manual Rev. 7.0
3.3 Managing References