1.
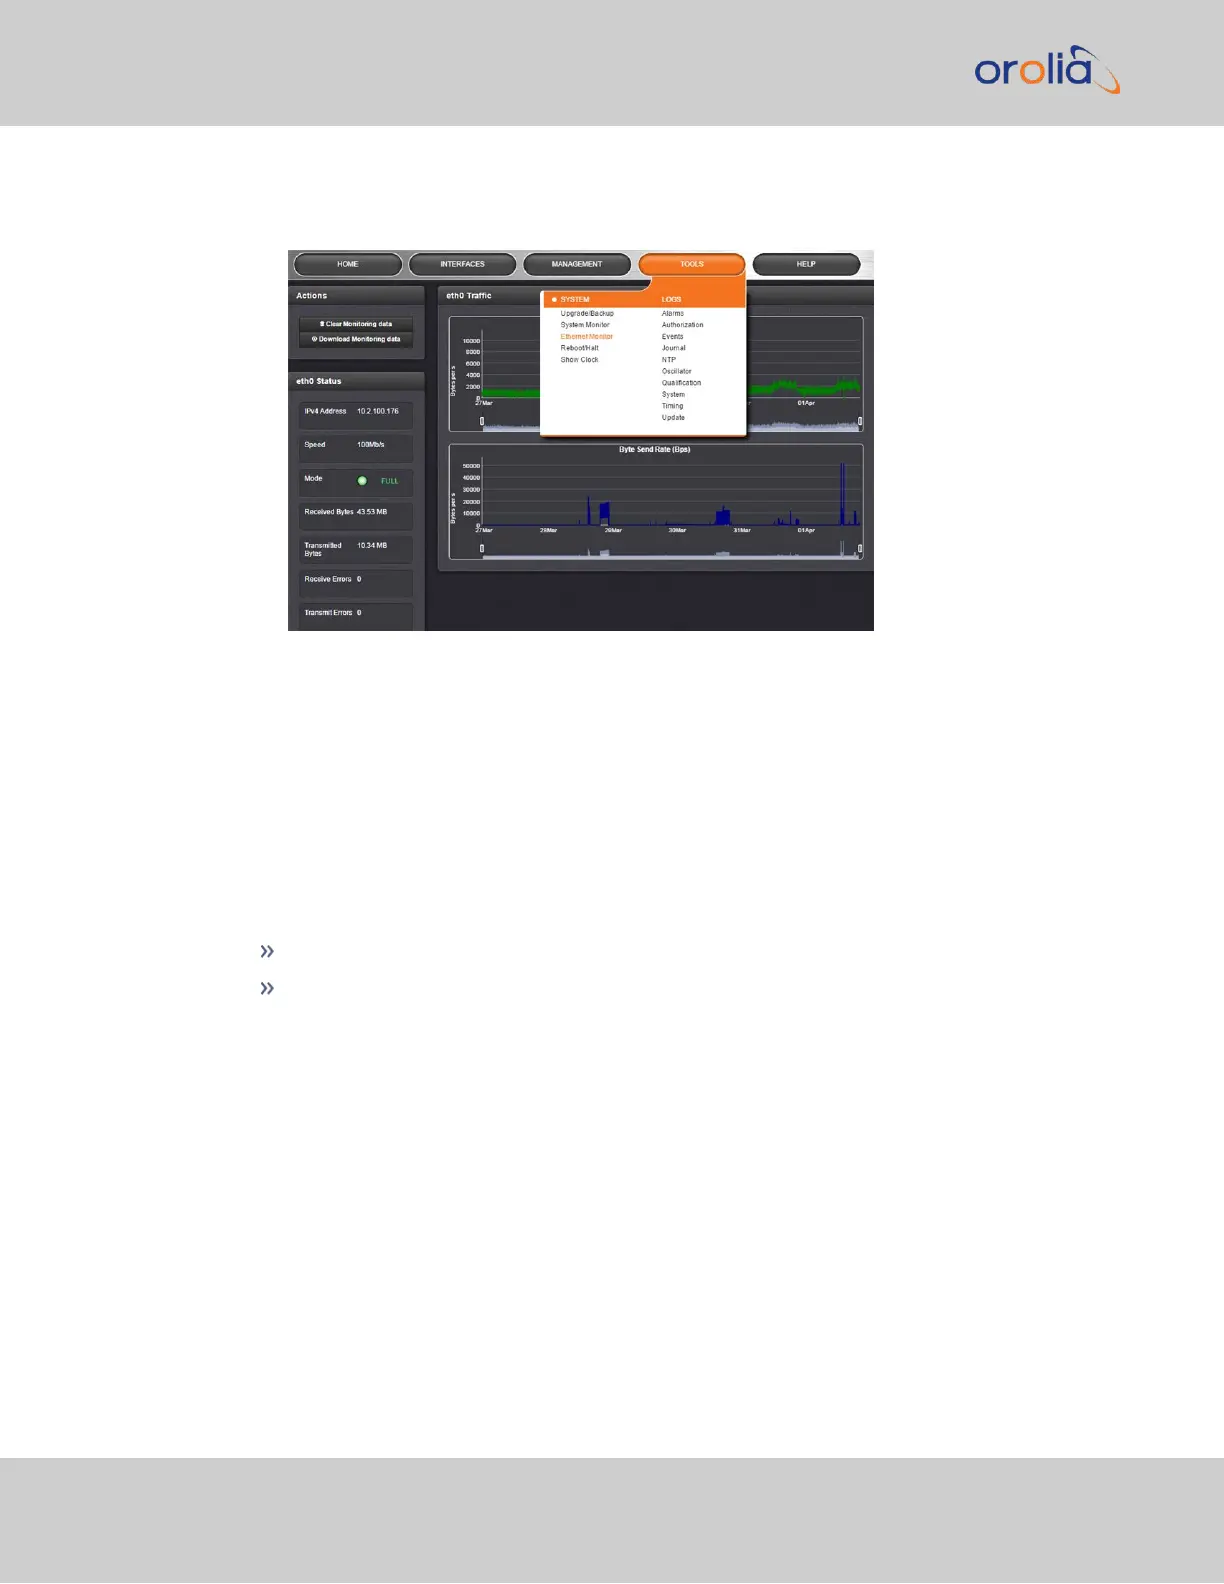
Navigate to TOOLS > SYSTEM: Ethernet Monitor. The Ethernet monitoring
screen opens:
The data displayed is linked to a specific Ethernet port e.g., ETH0. If you enable additional
Ethernet ports, their throughput data will also be displayed.
In the Traffic pane on the right the traffic throughput in Bytes per second is displayed in
two graphs. Drag the handles at the bottom of the graphs to zoom in on a particular time
frame.
In the Actions panel on the left, you can clear or download monitoring data.
In the Status panel on the left, information pertaining to the given Ethernet port is dis-
played, including throughput statistics and error statistics. The Mode field indicates which
transmission mode is being used for the given Ethernet port:
FULL duplex, or
HALF duplex.
Note that the Mode is auto-negotiated by VersaSync. It can be changed only via the switch
VersaSync is connected to, not by using the VersaSync WebUI.
4.6.1.3 Monitoring the Oscillator
The Oscillator Management screen provides current and history status information on dis-
ciplining state and accuracy.
To access the Oscillator Management screen:
234
CHAPTER 4 • VersaSync User Manual Rev. 7.0
4.6 Quality Management