1.
Navigate to MANAGEMENT > NETWORK: NTP Setup.
2.
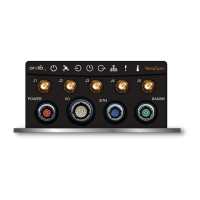
In the NTP Status Summary panel locate the Time Offset graph.
3.
Click the graph in the NTP Status Summary panel.
4.
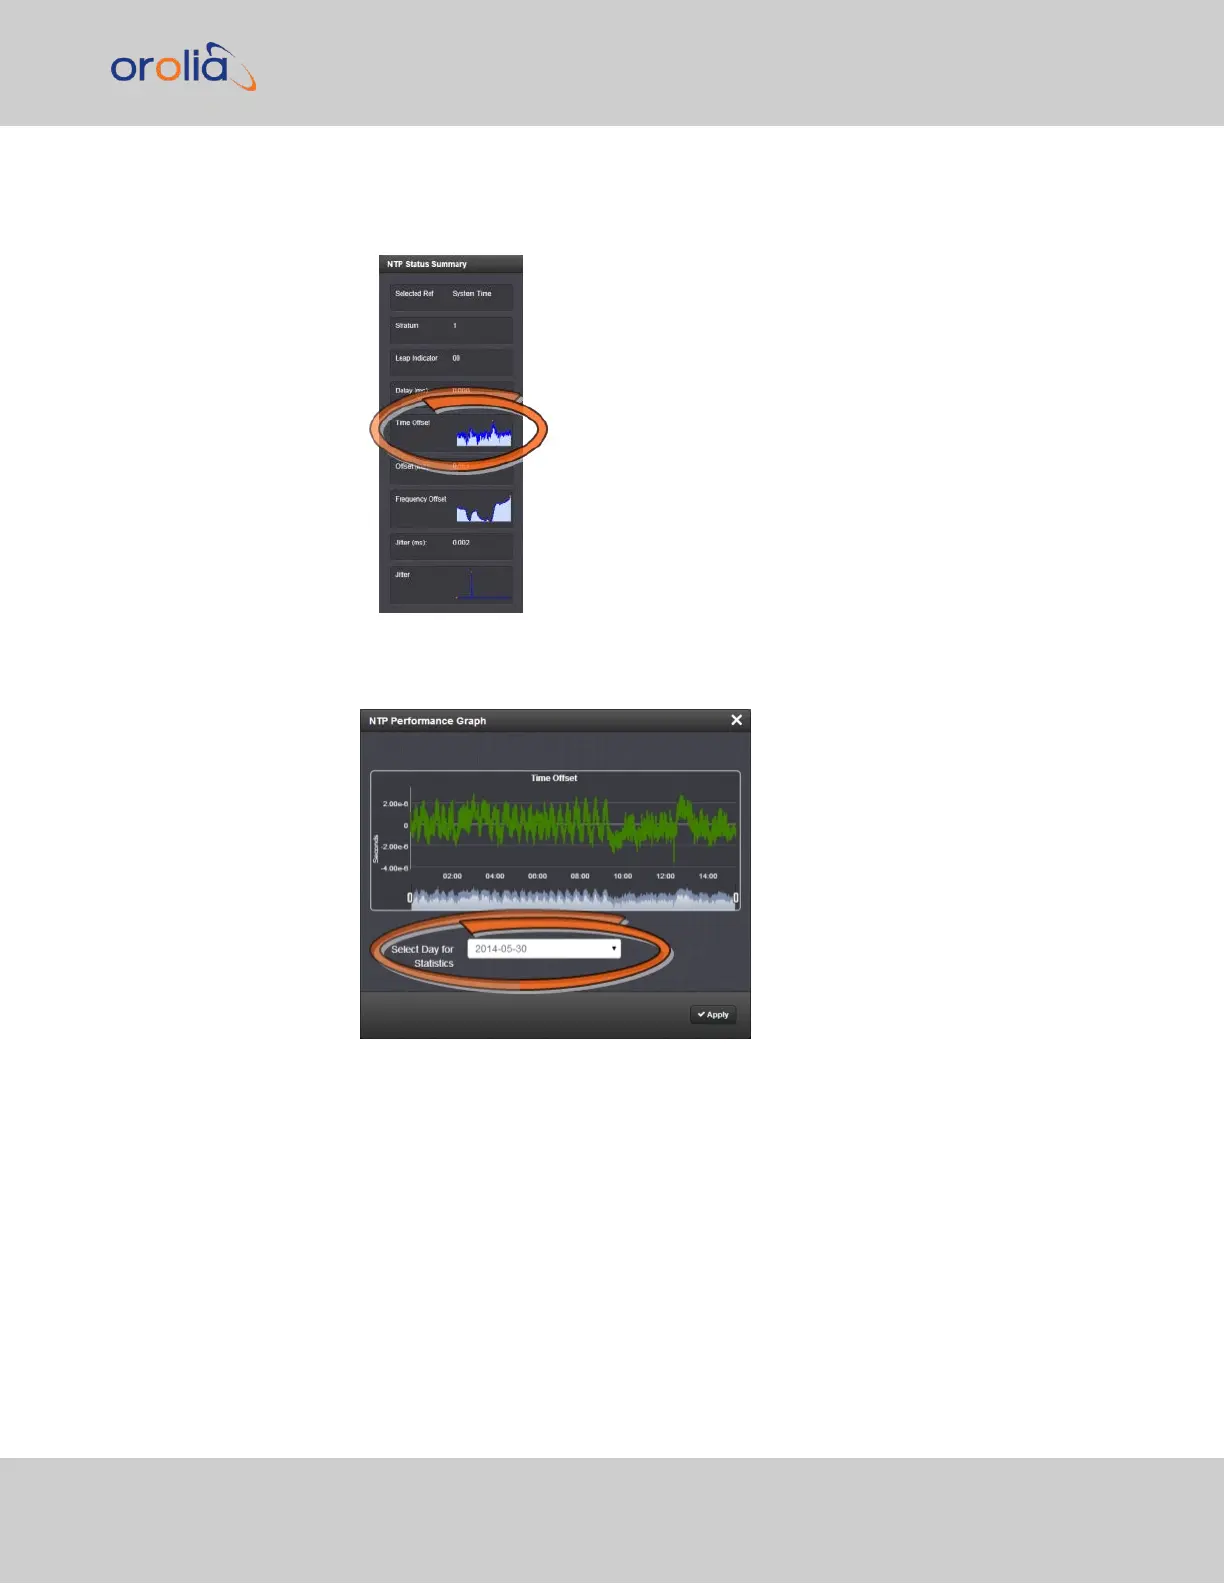
The NTP Performance Graph panel will appear.
5.
To select the statistics for a particular day, select a date from the drop-down list in
the Select Day for Statistics field. The default date is the present date. Click Apply.
6.
To display a higher resolution graph for a shorter time span, move one or both time
4.6 Quality Management
CHAPTER 4 • VersaSync User Manual Rev. 7.0
239