Status and Information
40
900-0209-01-00 Rev A
Graph Screens
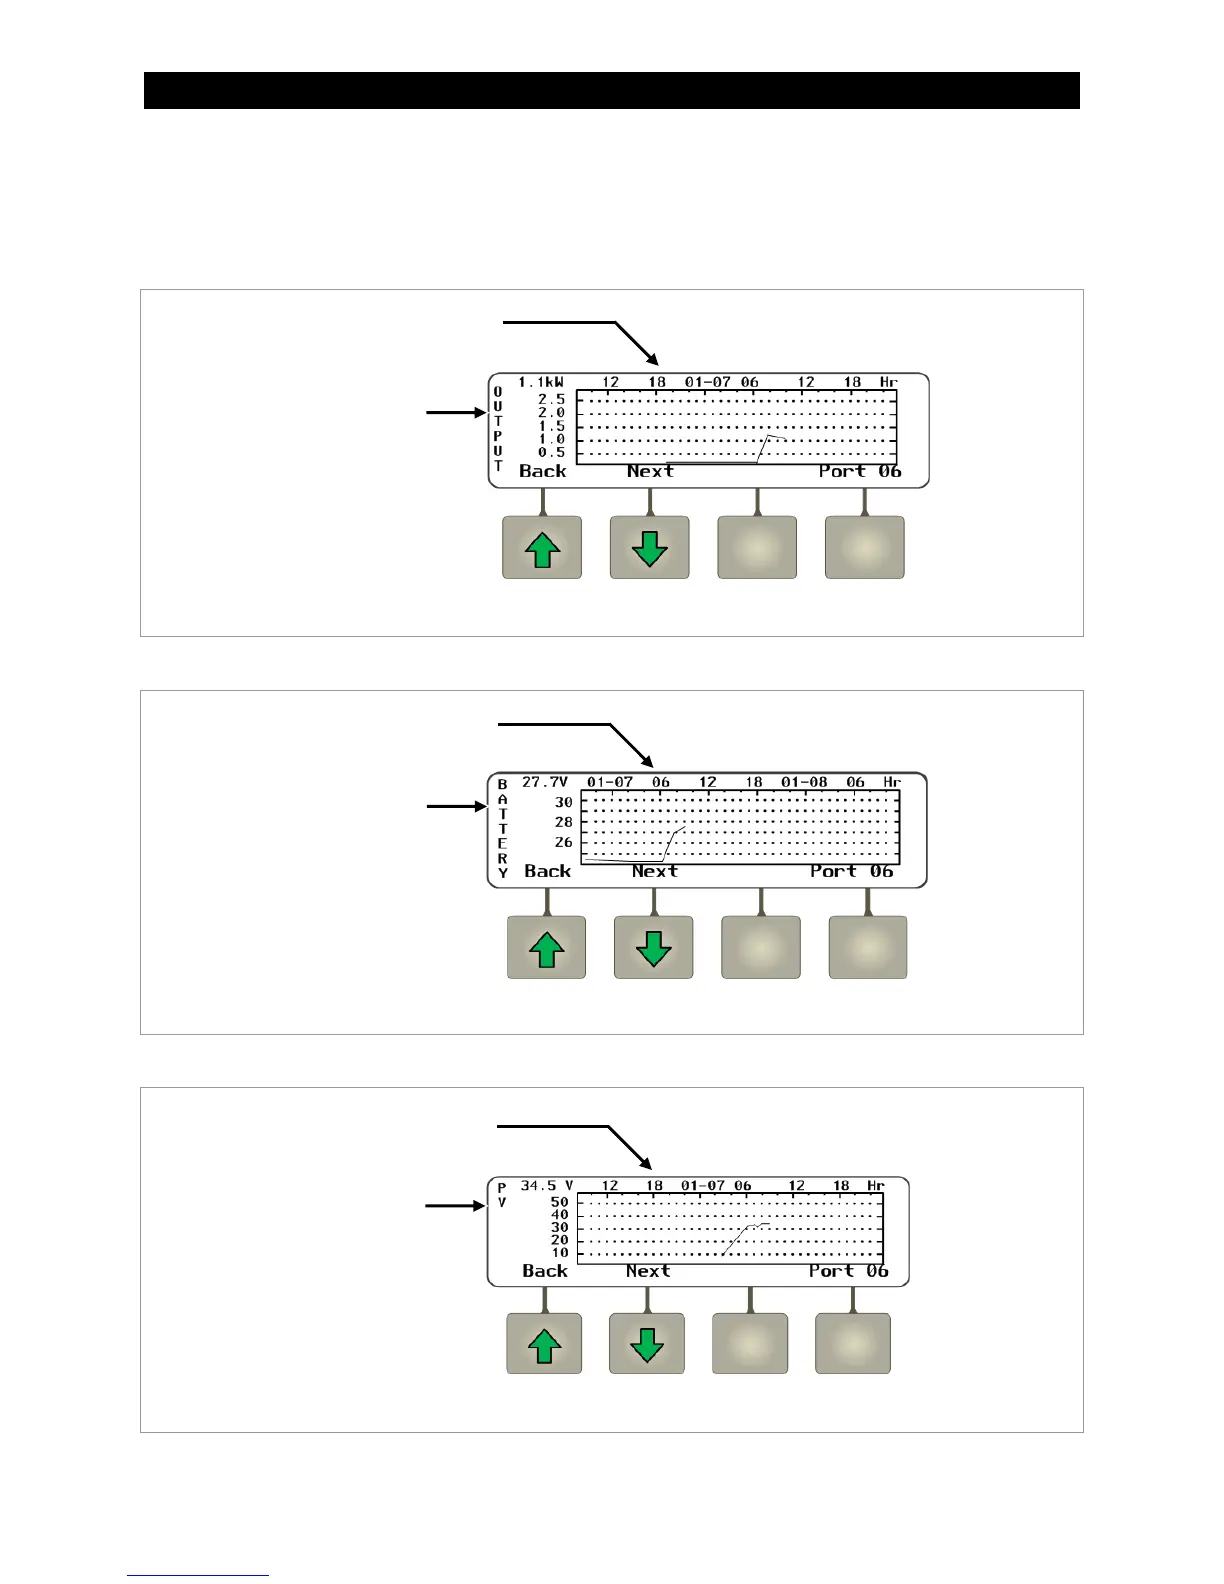
The <Graph> soft key brings up the following screens which plot various types of data over time.
The first screen shows changes in PV wattage over time.
Figure 33 Output Graph
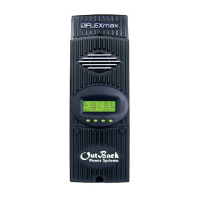
The <Next> soft key brings up a screen showing changes in battery voltage over time.
Figure 34 Battery Graph
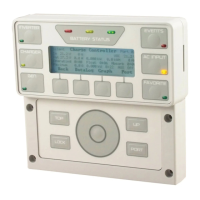
The <Next> soft key brings up a screen showing changes in PV voltage over time.
Figure 35 PV Graph
Continuing to press the <Next> soft key will proceed through the same graphs again from the beginning.
This axis shows date and time
in 6-hour increments.
This axis shows PV
wattage.
This axis shows date and time in
6-hour increments.
This axis shows
battery voltage.
This axis shows date and time
in 6-hour increments.
This axis shows
PV voltage.