Instrument Methods . 65
10. Set the Factor by which the absorbance is multiplied to give the concentration using
the left and right arrows.
The available range is from 0.01 to 9999.
11. Press OK
to start measurements.
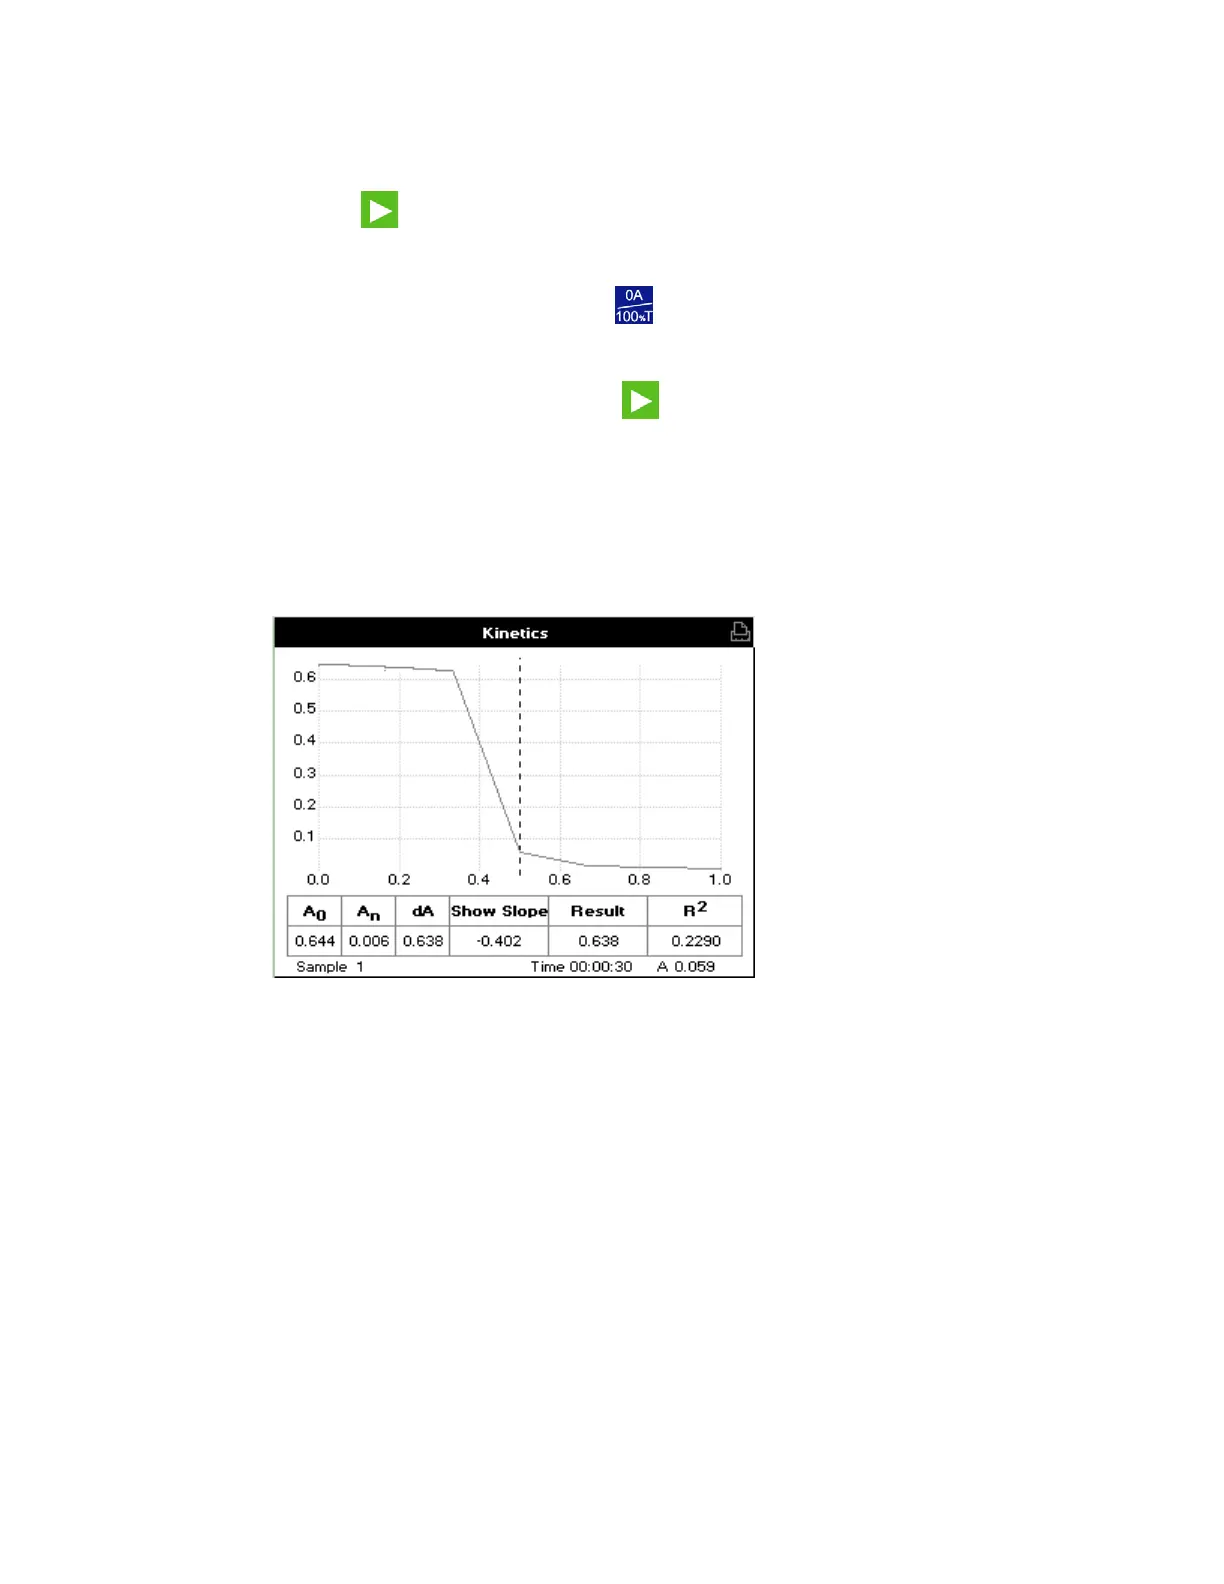
The Kinetics results screen is displayed.
12. Insert the reference sample and press
.
This reference measurement will be used for all subsequent samples until repeated.
13. Insert your first sample and then press
to start the run.
The running Time is displayed at the bottom of the screen, and absorbance data are
plotted on the graph as the measurement proceed.
The table below the graph displays A
0,
the absorbance value at t
0
(start of calculation);
A
n,
the absorbance value at t
n
(finish of calculation); dA, the change in absorbance; the
Slope and the regression parameter (R
2
) of the calculated slope. The concentration is a
calculated using the parameters selected in Method Settings 2 (dA, Final A or Slope) –
the name of the Result table column depends on the units chosen in Step 9.
Use the left and right arrows to move the cursor and display the time and absorbance
value at measured data points.
Use the up and down arrows to zoom in or out.