Owner’s Manual
AutoCode
®
Blood Glucose Meter AutoCode
®
Blood Glucose Meter
65
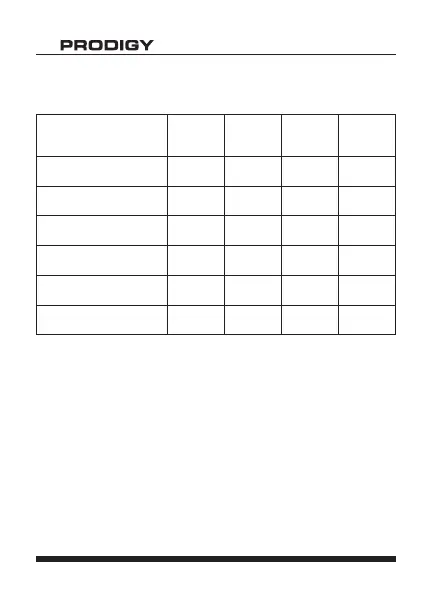
Table 2 represents samples for glucose results greater
than (≥) 75 mg/dL.
Difference between
laboratory and Prodigy
AutoCode® meter
Within
±
5 %
Within
±
10 %
Within
±
15 %
Within
±
20 %
number (%) for Finger
Blood
30/86
(35%)
59/86
(69%)
85/86
(99%)
86/86
(100%)
number (%) for palm
blood
29/86
(34%)
54/86
(63%)
83/86
(97%)
86/86
(100%)
number (%) for fore-
arm blood
28/86
(33%)
59/86
(69%)
83/86
(97%)
86/86
(100%)
number (%) for upper
arm
32/86
(37%)
63/86
(73%)
82/86
(95%)
86/86
(100%)
number (%) for calf
blood
30/86
(35%)
53/86
(62%)
84/86
(98%)
86/86
(100%)
number (%) for Thigh
blood
23/86
(27%)
48/86
(56%)
83/86
(97%)
86/86
(100%)
Linear regression analysis:
Finger: y = 1.0177x - 2.6955; R² = 0.975
Palm: y = 1.0437x - 6.3933; R² = 0.9698
Forearm: y = 0.9628x + 5.9635; R² = 0.9675
Upper arm: y = 1.0175x - 3.9439; R² = 0.9681
Calf: y = 1.0058x - 2.4028; R² = 0.9684
Thigh: y = 1.0137x - 3.3484; R² = 0.9576
• Precision: This study shows the CV (correlation
variation) is less than 5%.