PLX3x Series Diagnostics and Troubleshooting
Ethernet and Serial Gateways User Manual
ProSoft Technology, Inc. Page 41 of 218
May 26, 2016
3.2.3 Using the Data Analyzer (Serial Protocols Only)
The Data Analyzer is an extremely valuable troubleshooting tool available in
PCB. It allows you to “see” the data packets entering and leaving the serial ports
on the gateway. You can also capture this data to a log file.
Note: The PCB Data Analyzer is for serial ports only. To analyze data traffic on an Ethernet port,
we recommend using a network protocol analyzer available on the Internet, such as Wireshark.
To use the Data Analyzer
1 Open the Diagnostics window in PCB.
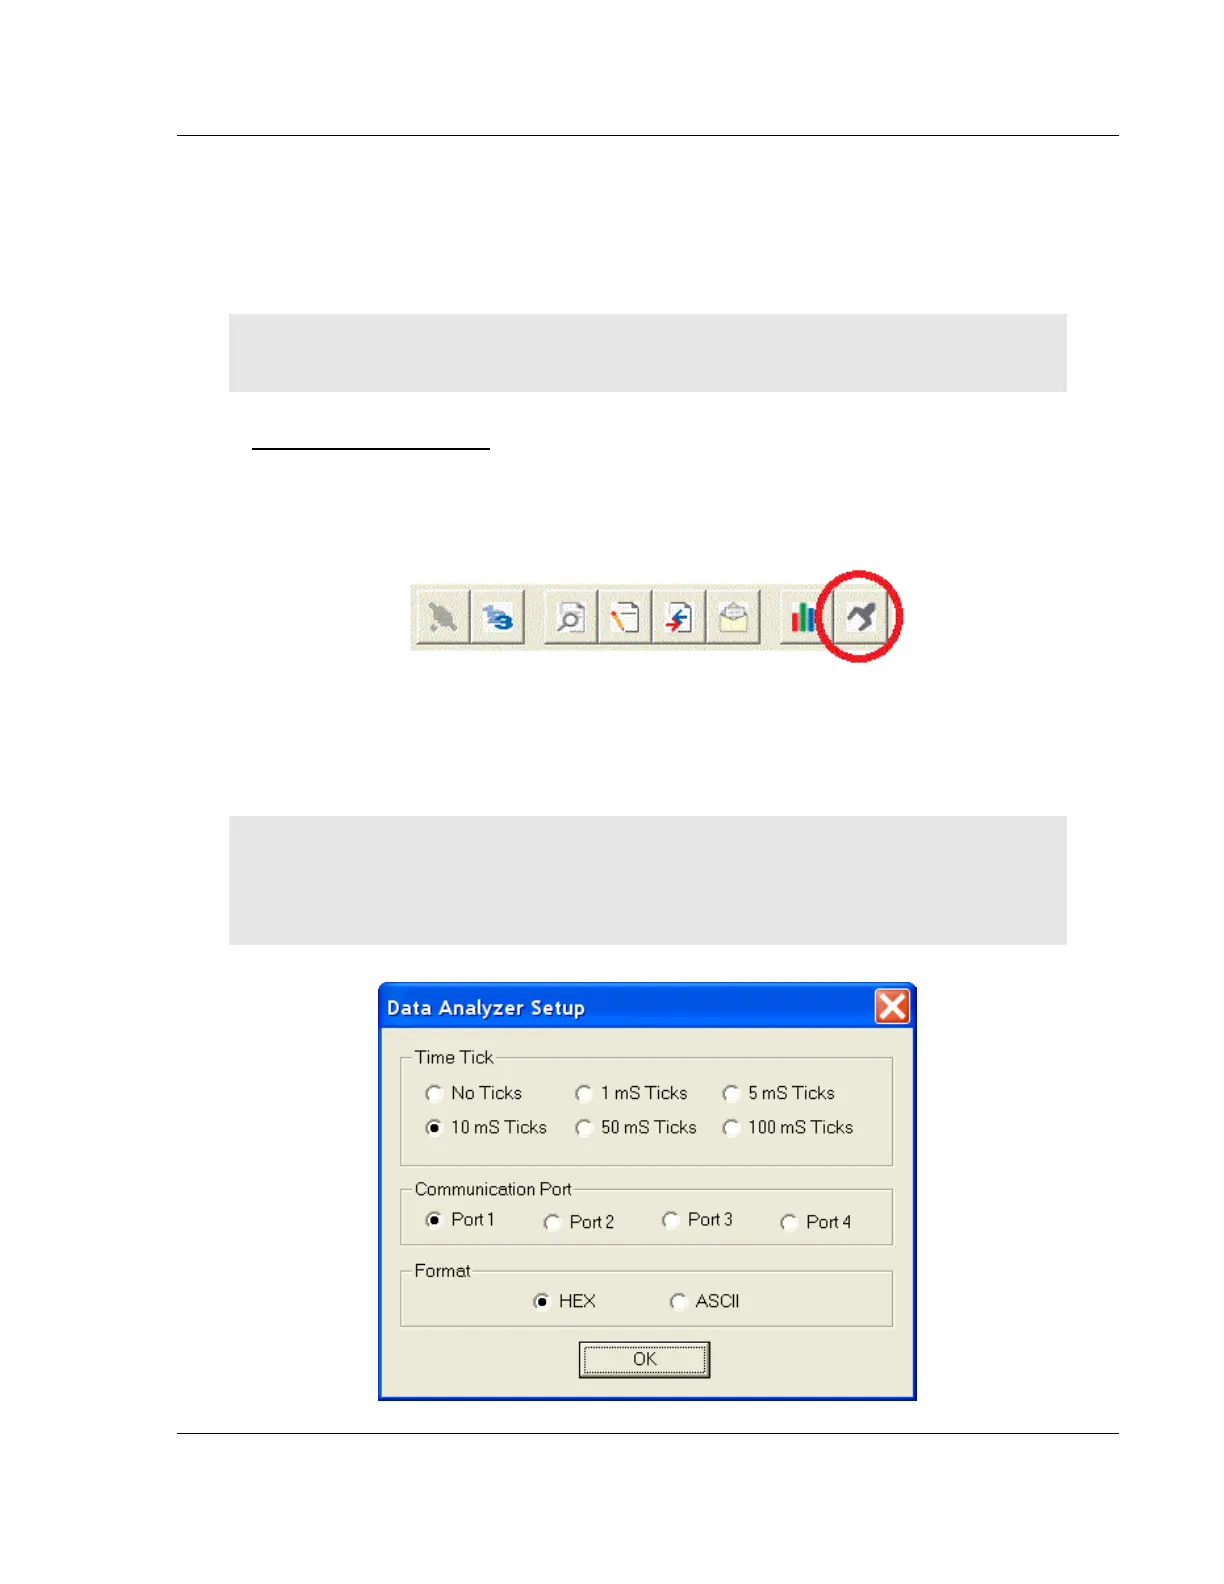
2 On the toolbar at the top of the window, click the Setup Data Analyzer
button.
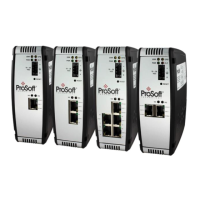
3 In the Data Analyzer Setup dialog box, specify the time tick interval, the serial
port number, and whether the data packet contents should be displayed in
hexadecimal number or ASCII character format. Click OK.
Note: The time tick is a symbol (_TT_) displayed on the Data Analyzer screen that allows you to
estimate time intervals during a Data Analyzer session. The time tick will print at the time interval
you specify in the Data Analyzer Setup dialog box. For example, if you select 10 mS Ticks, it will
print every 10 milliseconds.