Installation and setup
Page C-26 Operator’s Manual PiCCO
2
Version 3.1
Display of results
The single TD results are displayed in table form. All measurements of one set must be done directly following
each other. The maximum time frame for the measurements is 10 minutes.
Older measurements are displayed in grey and not included in the current average. Active values are
displayed in white. Measurements which are excluded from the average are crossed out.
All active curves can be displayed at a later time by selection. Older measurements are still available in table
form.
Scaling of a thermodilution curve can be changed in two steps by touching the curve.
L New in version 3.1: The values for injectate volume (Vinj) and injectate temperature (Tinj) are both displayed
in the thermodilution table.
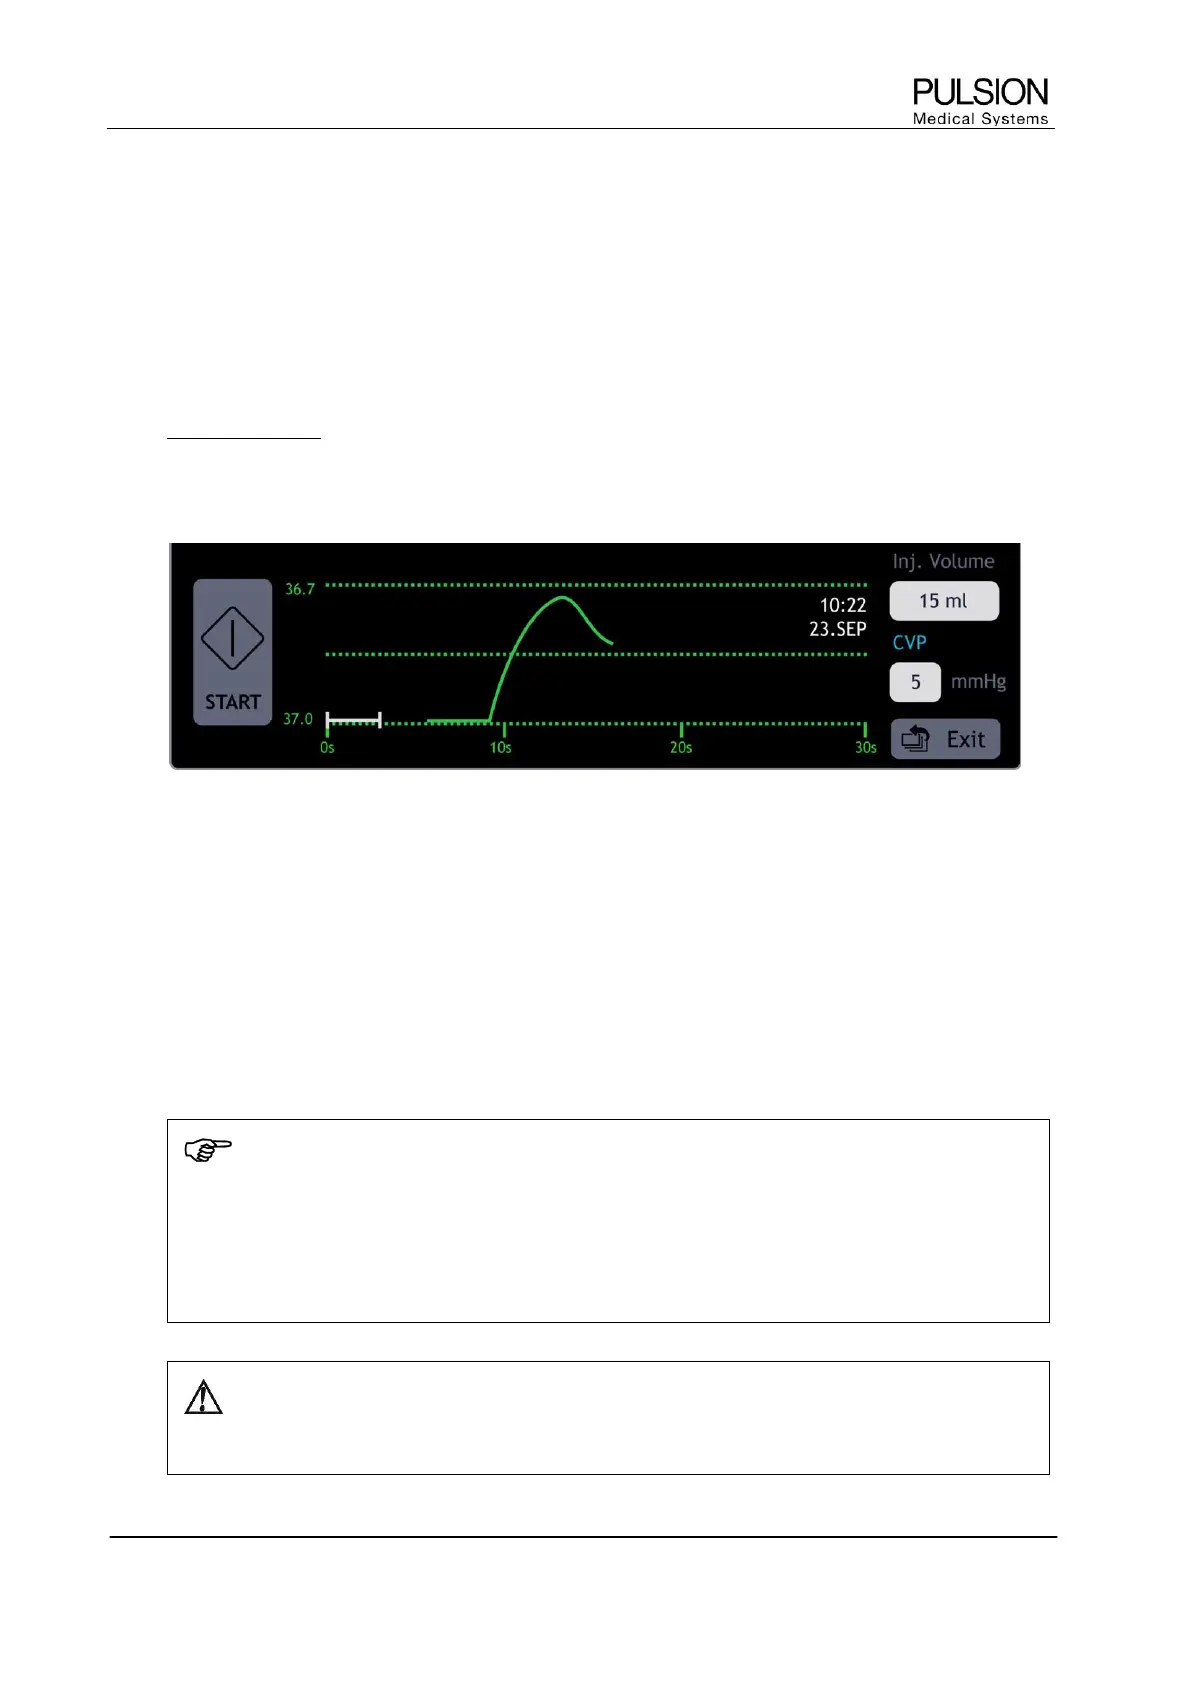
Quality of a thermodilution measurement:
Figure 29: Thermodilution curve
x A normal curve has one smooth peak and then returns in direction to the baseline.
x The maximum temperature difference (∆T) should exceed 0.10°C.
x The used injectate volume (Vinj), the measured injectate temperature (Tinj) and ∆T can be verified in
the table.
x Good measurements within one set of measurements are in close agreement. In case of a dispersion
of CO results of more than 20 %, the measurement is marked with a "?".
Æ Conspicuous measurements have to be rejected.
NOTE
In order to optimize the quality of the thermodilution curve you can use more and/or colder
injectate and inject as rapidly as possible.
Throughout the measurement the patient should remain as still as possible, the position of the
thermodilution catheter must not be moved and no further infusions or injections should be
administered.
CAUTION: Faulty measurements can be caused by incorrectly placed catheters, interfering signal
transmission e.g. of arterial pressure, defective connections or sensors, or by electromagnetic
interference (e.g. electric blankets, electric coagulation).