ASMxxxx Series User’s Manual
Asia Pacific | EMEA | Americas 50
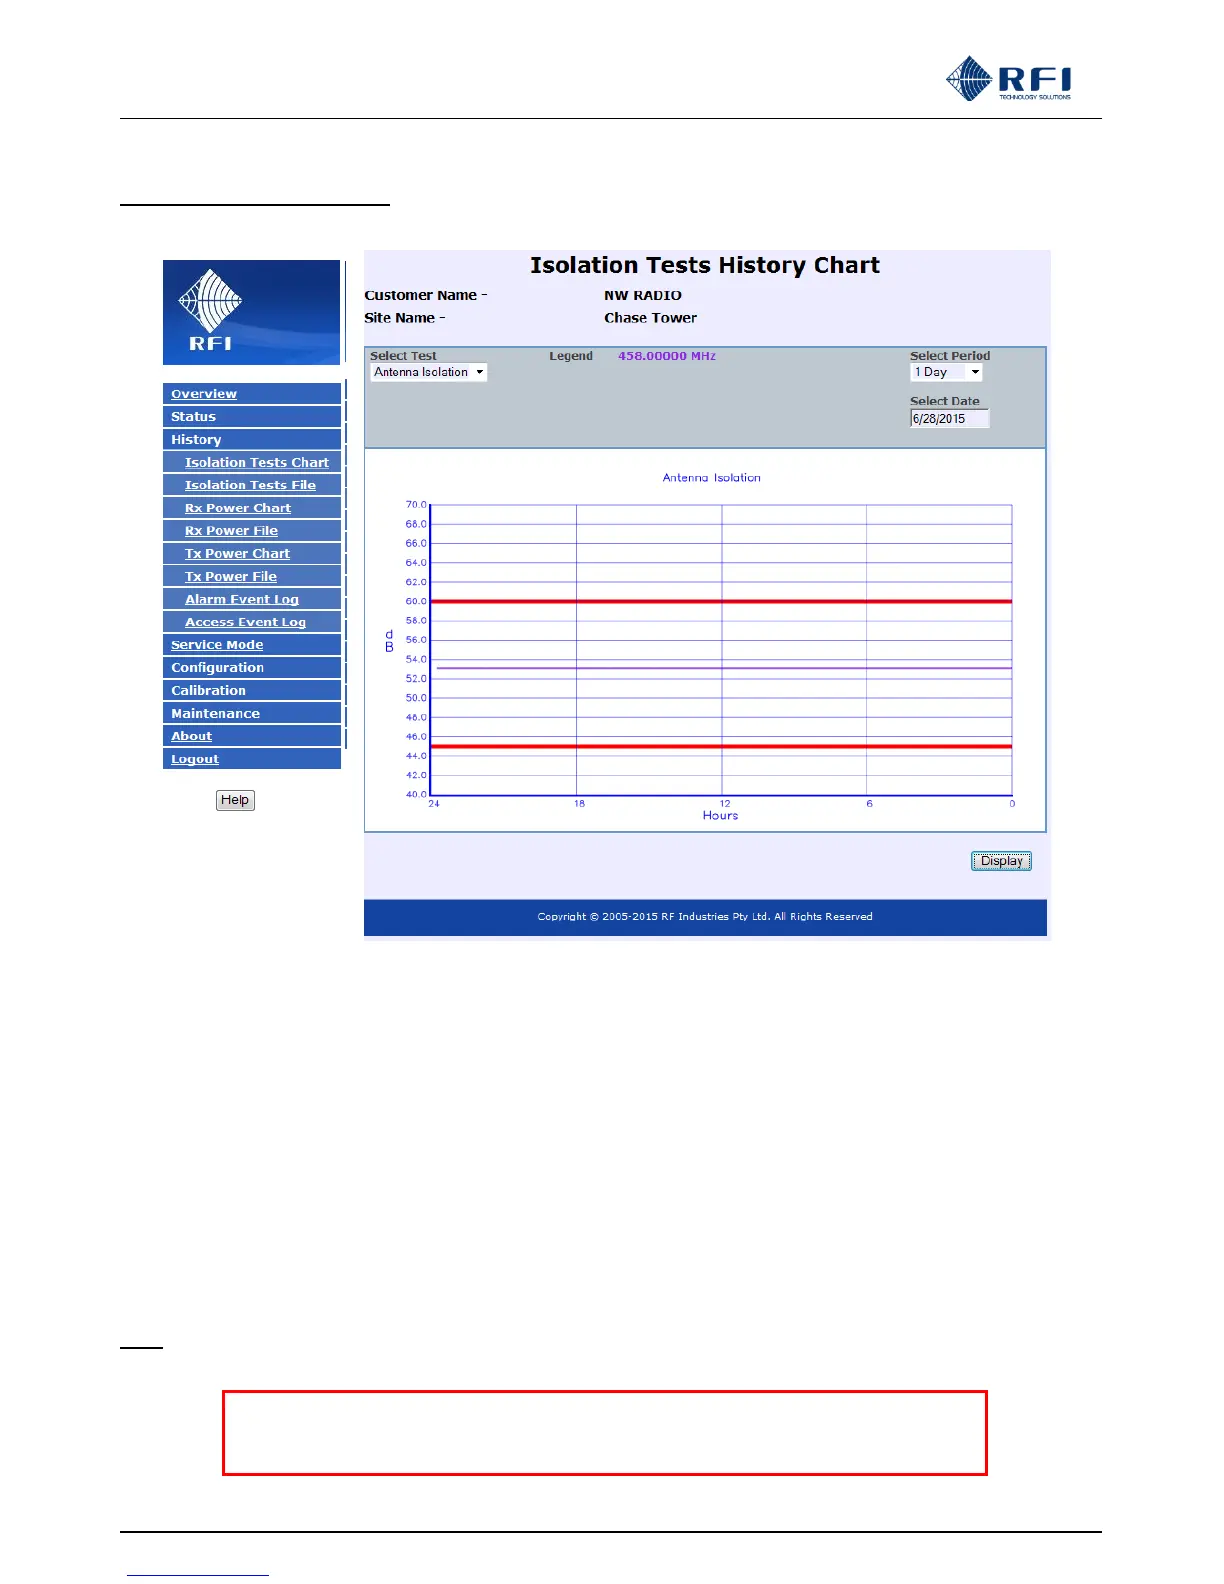
10.15 History – Isolation Tests
Example of Antenna Isolation Chart
This page displays the logged Isolation Tests values.
Select Test:
Select the Isolation Tests which you desire to display. Available selections are Antenna Isolation, Rx Gain and Tx Rejection.
Select Period / Select Date:
Select the past period (working back from the Select Date) for which logged data will be displayed. When the Select Date field is
selected, a calendar will appear allowing a past date to be nominated as the starting day for the Period to apply up until.
Display:
Clicking the Display button starts the collation of data that meets the selected criteria. Once the data is processed and the
updated chart created, the screen will refresh. This may take a period of time depending on the number of data values that
have been stored that meet the selected criteria.
Note: The red lines on the displayed graph represent the alarm max/min threshold values currently configured for this test.
NOTE: There are documented issues with Internet Explorer™ Version 10.
This may impact the presentation of some GUI features.
The use of an alternate web browser is recommended.