42 • Viewing, Printing, Exporting, and Deleting Data
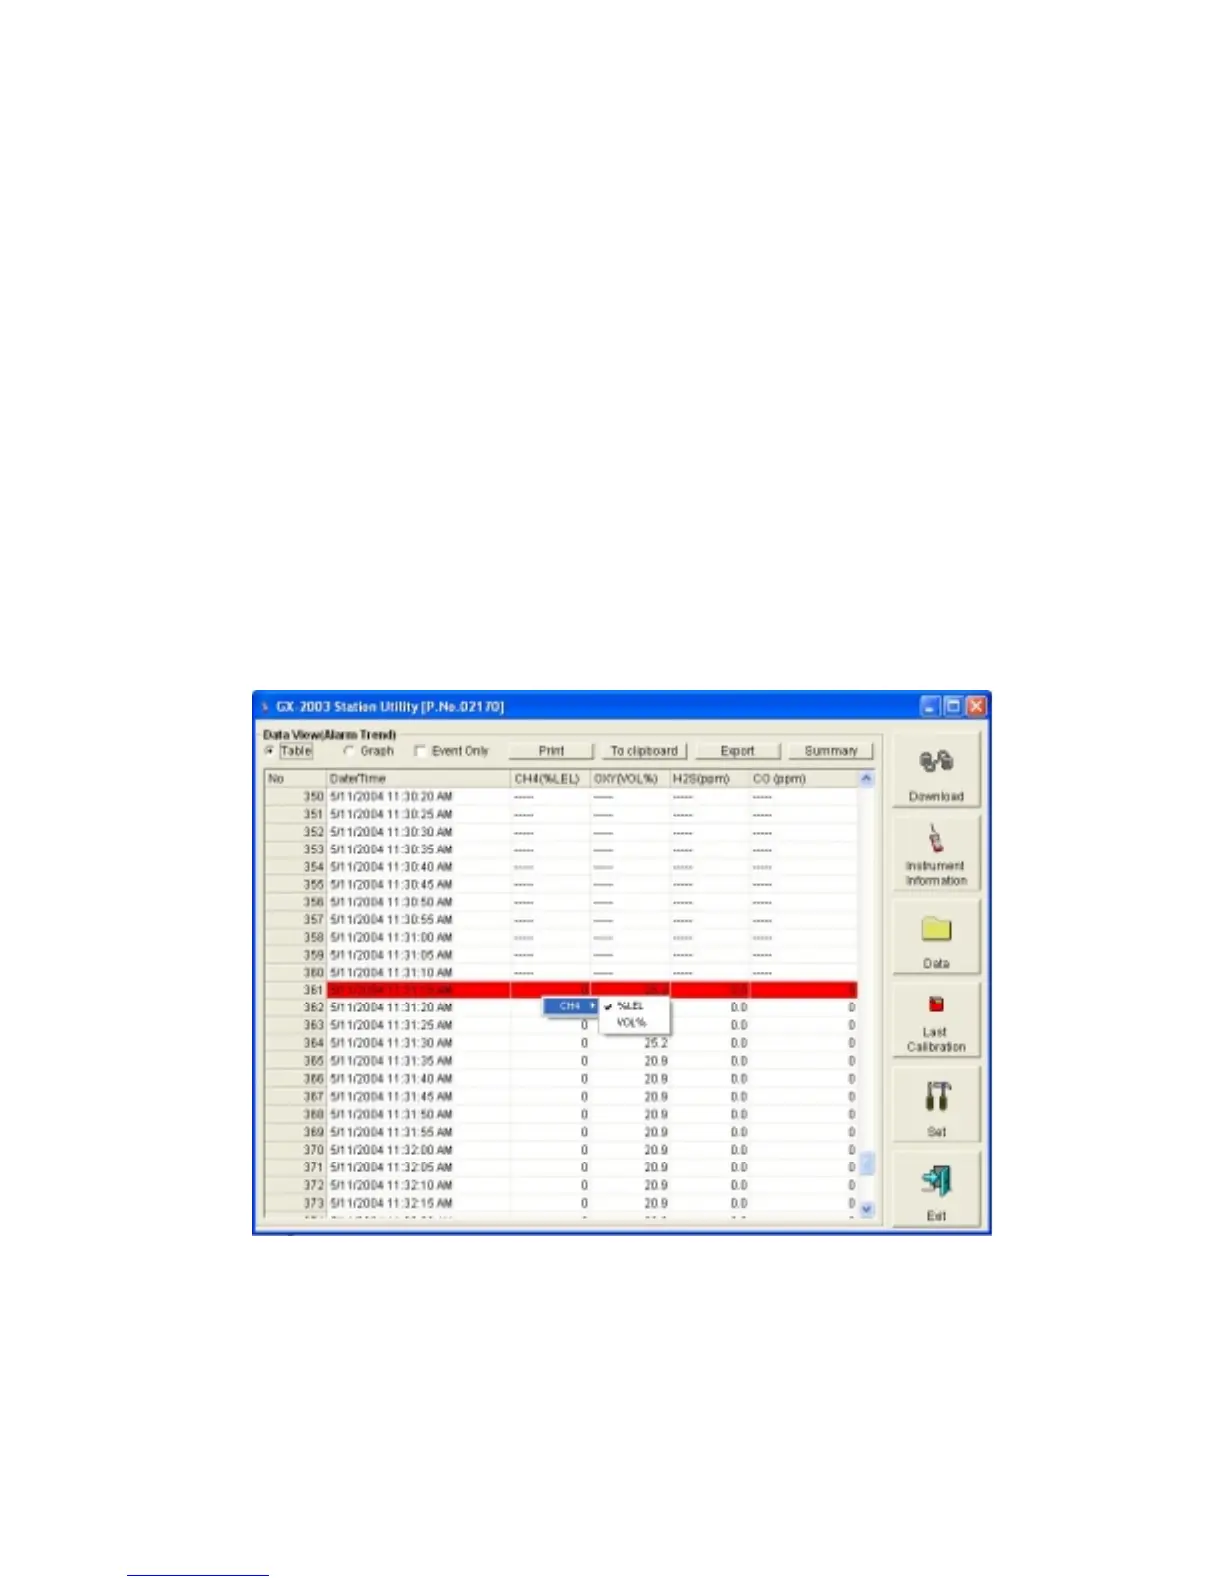
• The gas readings at the time of the alarm event around
which the logged data are centered are highlighted in red
and are the instantaneous readings at that time.
• If you click the Summary button, the data window will split
into two frames one above the other with the data table in
the lower frame and the summary information shown in
the upper frame. The summary information is the same as
the information shown in the lower right frame in
Figure 27.
8. If data is being viewed from an instrument that included a TC
%volume CH4 sensor, then it is possible that readings above
100% LEL were logged for the CH4 channel. To view the
CH4 readings in %volume instead of % LEL, right click in the
CH4 column. A selection box will appear that allows you to
choose between %LEL and VOL% for the CH4 display units.
9. To view the data in graph format, click the Graph button. An
alarm trend file can always be graphed regardless of the
number of logged points.
Figure 29: CH4 %LEL/%Volume Selection

 Loading...