Viewing, Printing, Exporting, and Deleting Data • 43
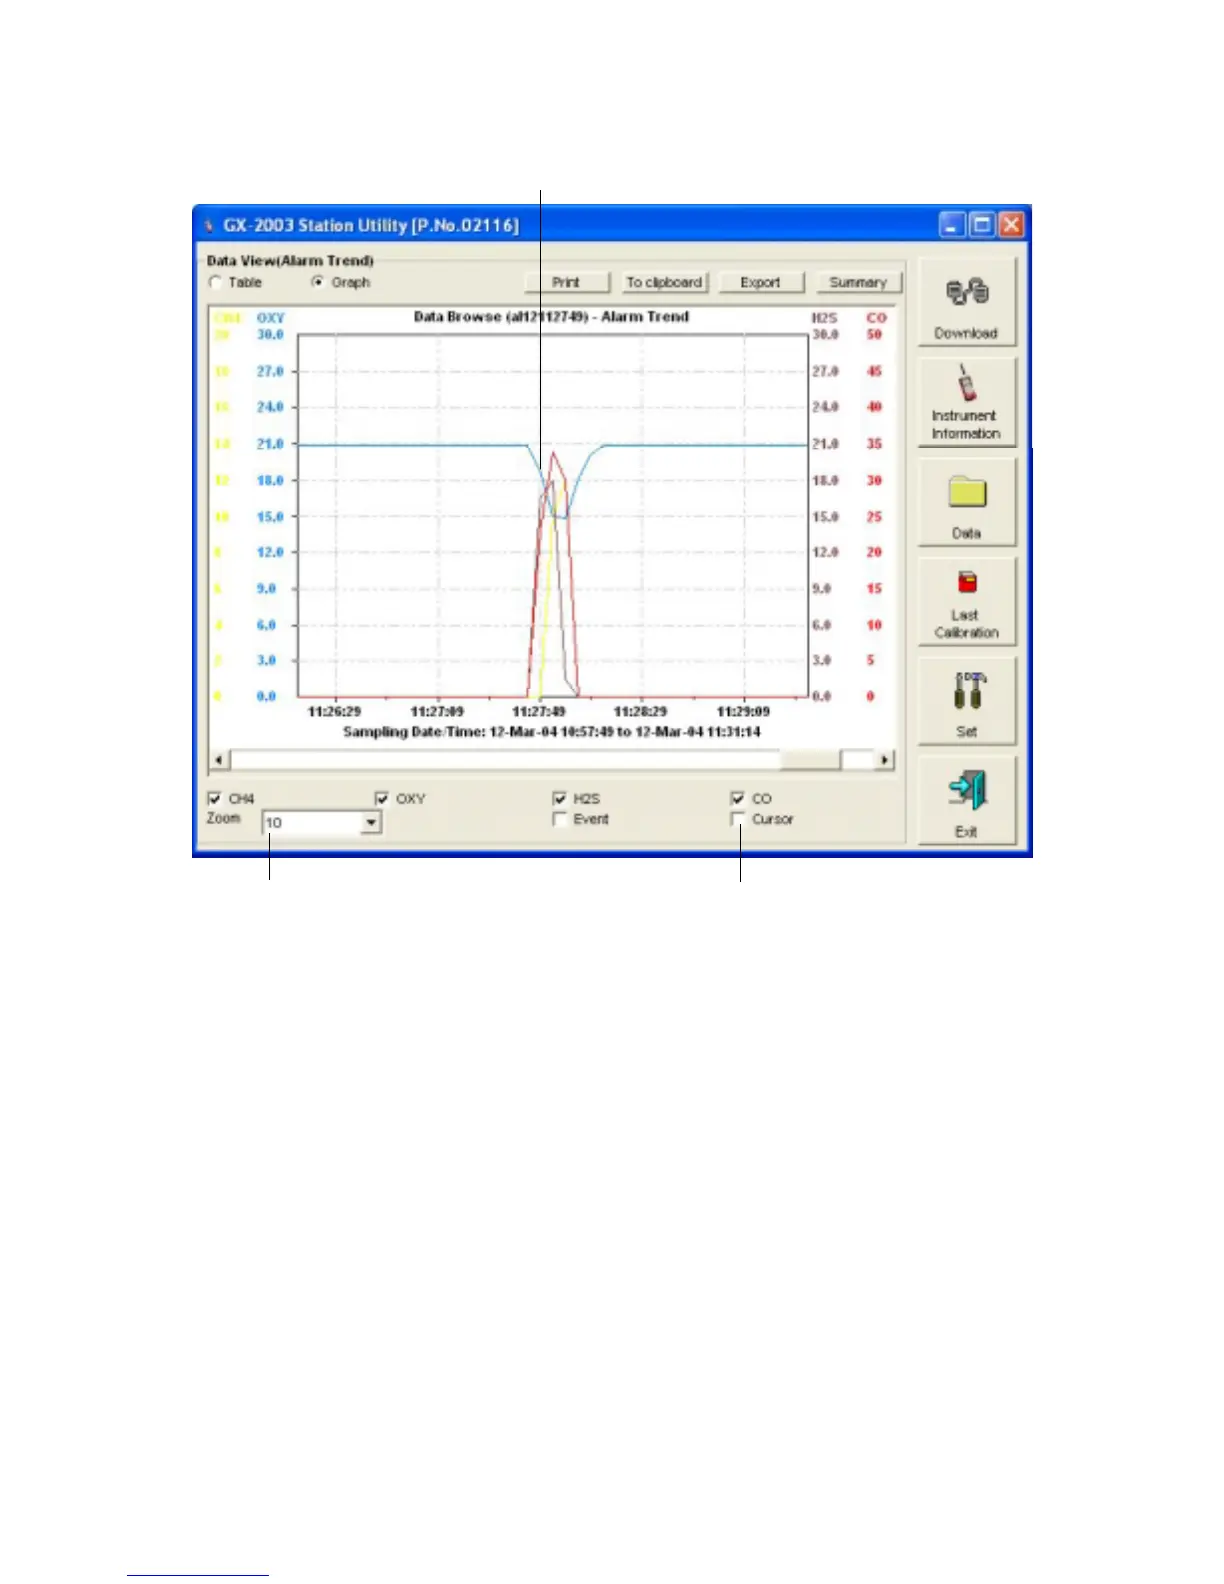
When viewing alarm trend data in graph format, you have all
the same options as when viewing interval trend data. See
instruction 9 on page 36 in “Interval Trend Data”.
10.To print the data, whether it is viewed in table or graph
format, click the Print button. A Print dialog box will appear
for you to select a printer. Data displayed in Graph view will
print as a graph and data displayed in Table view will print as
a table.
11.To export the data to another application, for example a
spreadsheet or database (for table data) or a word
processing or presentation program (for graph data), click
the Export button. A “Save As” dialog box will appear for you
Figure 30: Alarm Trend Data in Graph Format
Cursor feature
Zoom factor
Alarm event and gas concentration

 Loading...