Application and Operation
6.13 Input Side Monitoring and Protection
Product User Manual
Operating Instructions, Version AE 12/2009, A5E01454341C
139
Implementation
The follwing Figure shows the implementation of the Drive Loss fault circuit.
,QSXW3RZHU
2XWSXW3RZHU ,QSXW7KUHVKROG
)DXOW
'ULYH/RVVHV
,QYHUVH7LPH
Figure 6-14 Implementation of the Drive Loss Fault Circuit
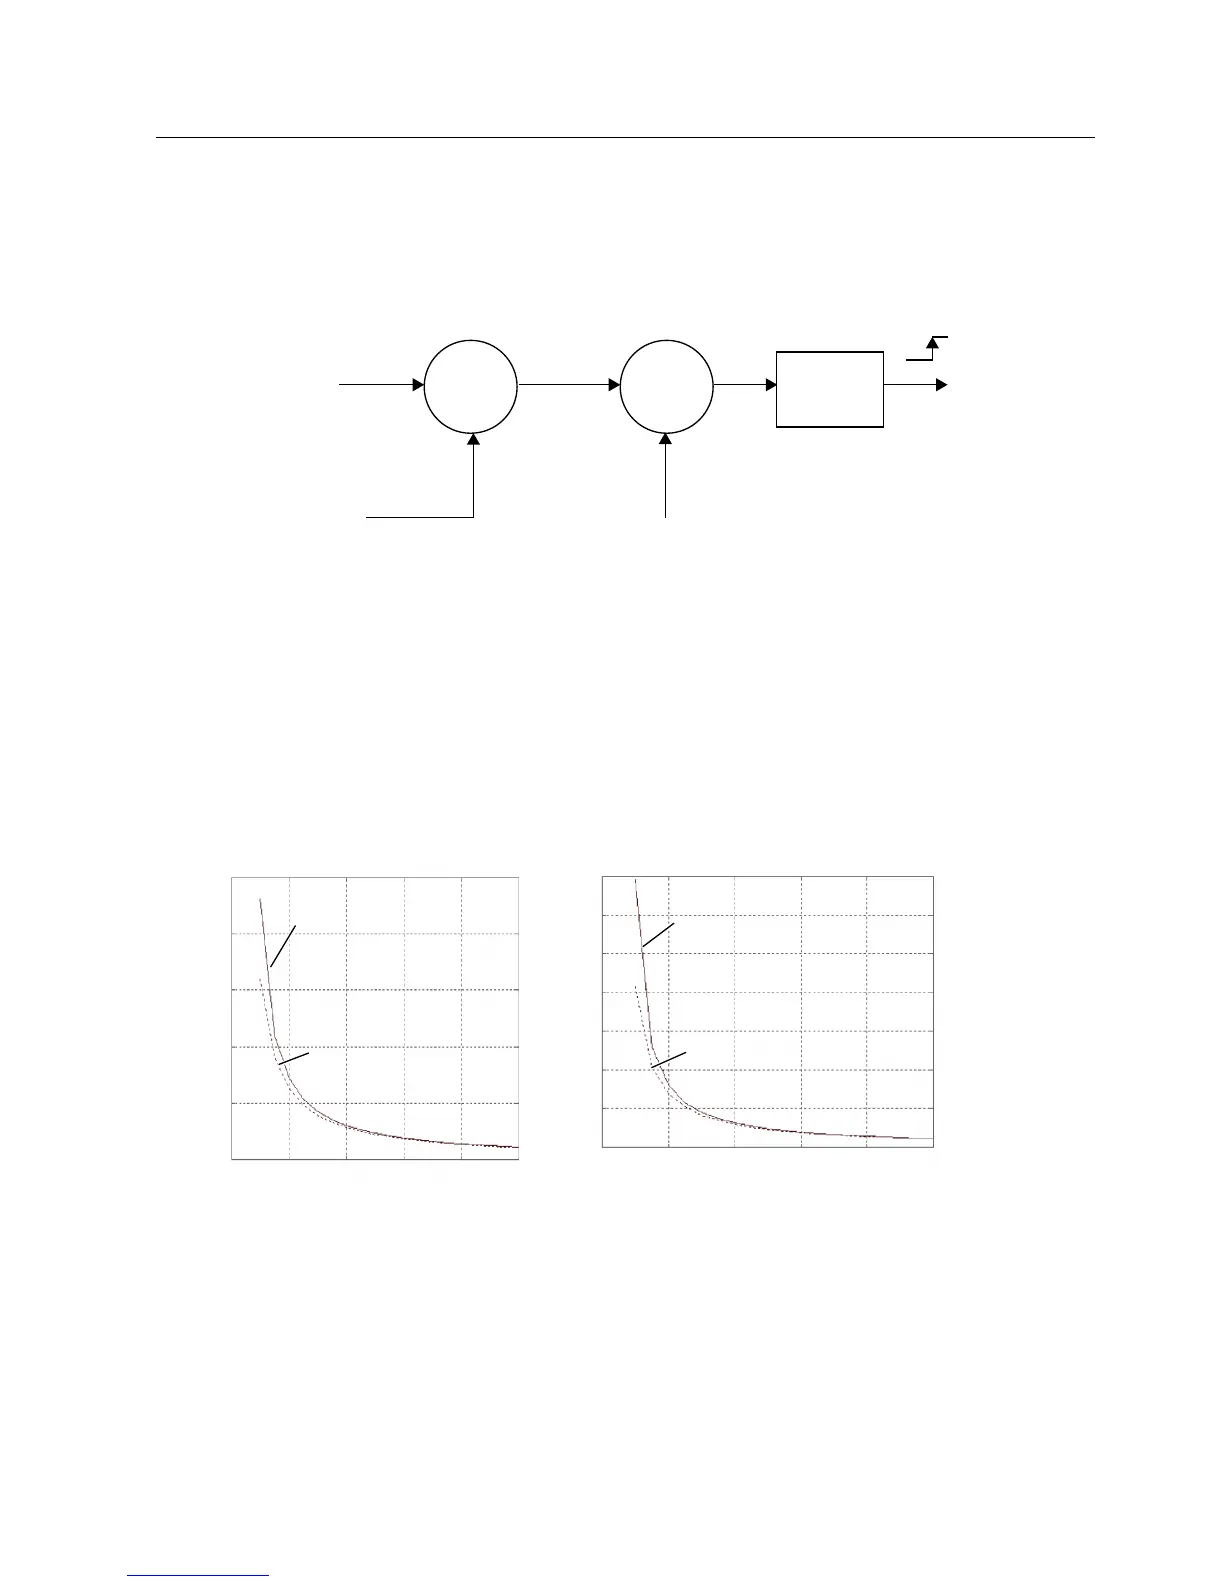
Inverse Time Curve
The follwing Figure shows the inverse time-to-trip curves as a function of Drive Losses. Each
plot shows two curves – one for Idle State and the other for Run State (slightly longer time to
trip). For software versions 2.22 and lower, a fixed trip time of one second was used instead
of the curves shown next.
'ULYH/RVVHV
7LPHWRWULSV
7LPHWRWULSV
'ULYH/RVVHV
5XQ6WDWH
,GOH6WDWH
5XQ6WDWH
,GOH6WDWH
([FHVVLYH'ULYH/RVV3URWHFWLRQ,GOH
([FHVVLYH'ULYH/RVV3URWHFWLRQ5XQQLQJ
Figure 6-15 Inverse Time-To-Trip Curves Left - Idle State, Right - Run State
 Loading...