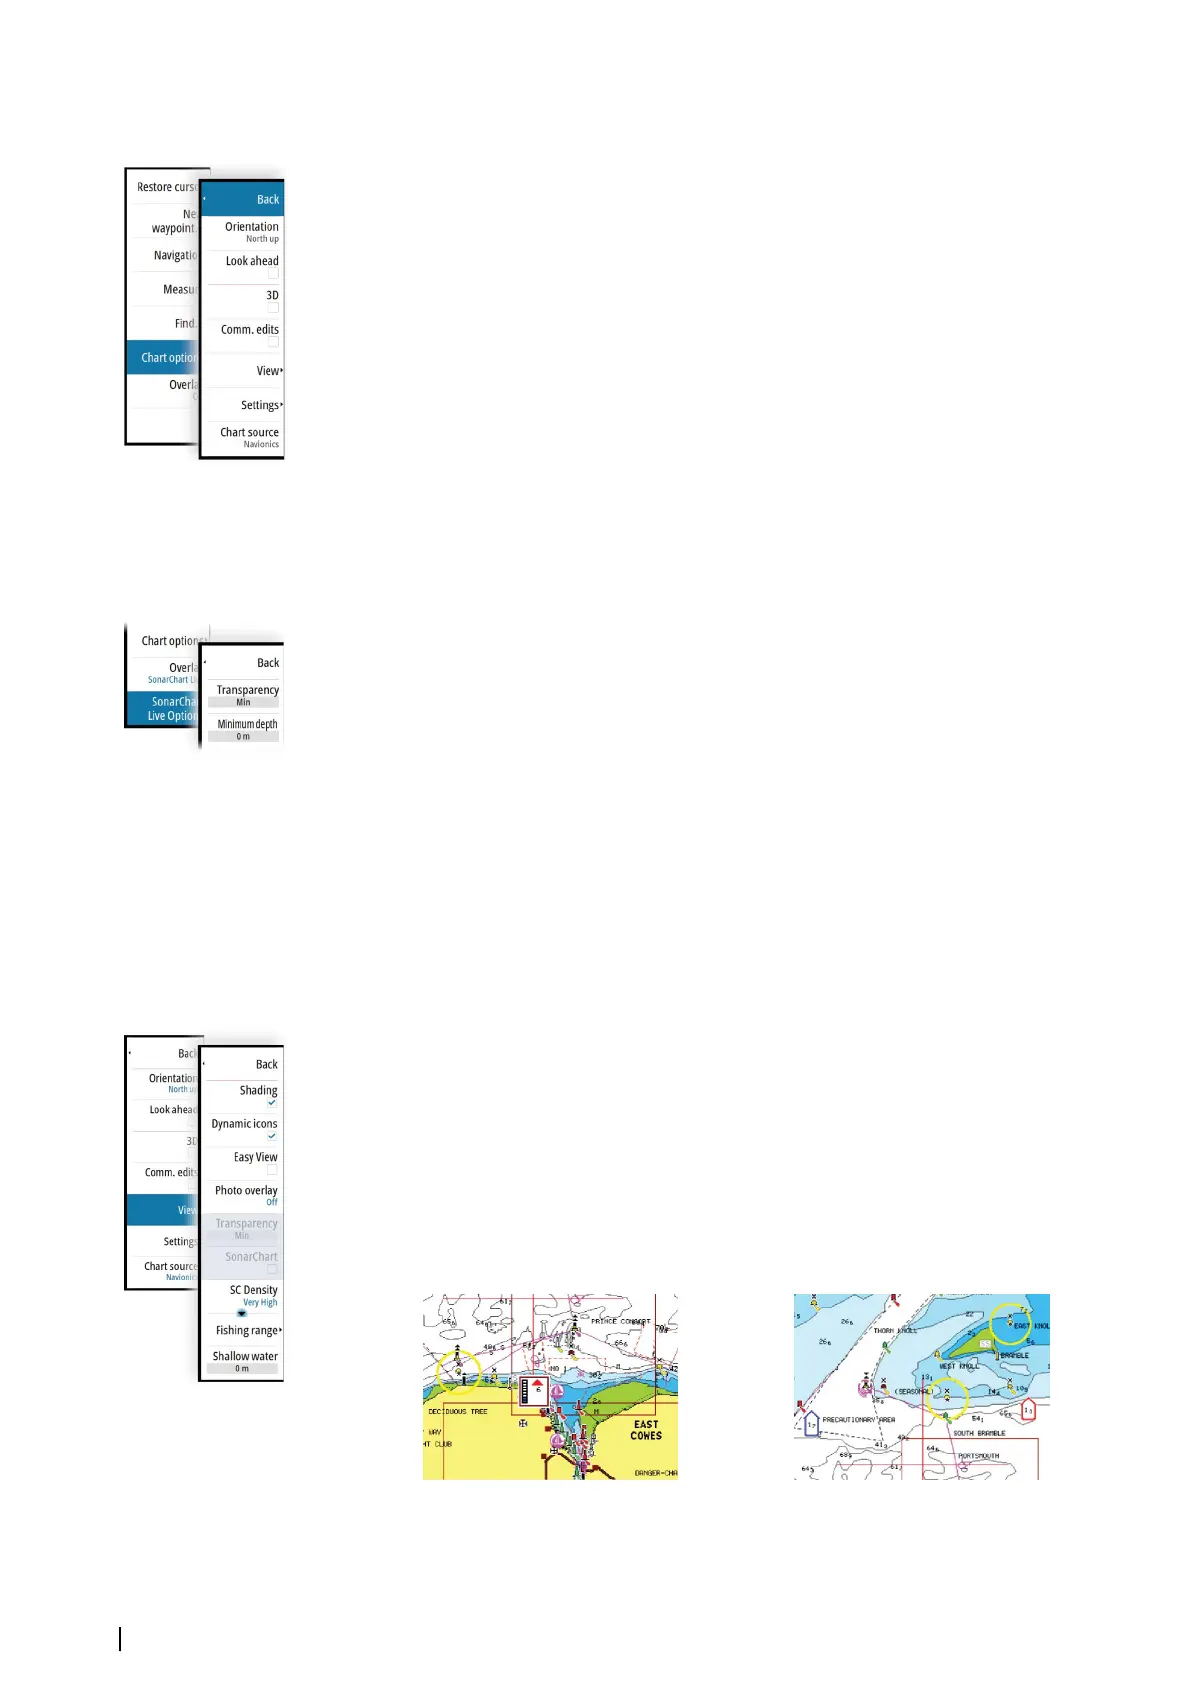
Navionics specific chart options
Orientation, Look ahead, 3D and change Chart source (previously described in this section)
are common for all chart types.
Community edits
Toggles on the chart layer including Navionics edits. These are user information or edits
uploaded to Navionics Community by users, and made available in Navionics charts.
For more information, refer to Navionics information included with your chart, or to
Navionics website: www.navionics.com.
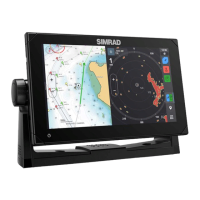
SonarChart Live
SonarChart Live is a real-time feature where the device creates an overlay of depth contours
based on your own live sonar soundings.
In the Navionics chart menu, select Overlay and then SonarChart Live to display it as an
overlay on the chart.
When you select SonarChart Live overlay the menu expands to display SonarChart Live
Options. Use the options to set the transparency and minimum depth.
Transparency
The SonarChart Live overlay is drawn on top of other chart data. The chart data is completely
covered at minimum transparency. Adjust the transparency to allow the chart details to be
seen.
Minimum depth
Adjusts what SonarChart Live rendering treats as the safety depth. This affects the coloring of
the SonarChart Live area. As the vessel approaches the safety depth, the SonarChart Live area
will gradually change from a simple grey/white to red.
SCL History
Ú
Note: If no active Navionics chart subscription is found, the SonarChart Live menu option
changes to SCL History.
Select to display previously recorded data on the chart overlay.
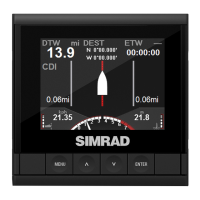
Navionics view options
Chart shading
Shading adds terrain information to the chart.
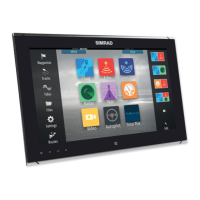
Navionics dynamic tide and current icons
Shows tides and currents with a gauge and an arrow instead of the diamond icons used for
static tides and current information.
The tide and current data available in Navionics charts are related to a specific date and time.
The system animates the arrows and/or gauges to show the tides and currents evolution
over time.
Dynamic tide information Dynamic current information
The following icons and symbology are used:
36
Charts | NSO evo3 Operator Manual