50
Tab. 8-3 Explanation of power yields records
Display the power output in a single day. Each point in the
curve is the percentage of present power and nominal
power.
Daily charge and
discharge curve
Display daily discharge and charge volumes.
Monthly charge and
discharge curve
Display monthly discharge and charge volumes.
Annual charge and
discharge curve
Display annual discharge and charge volumes.
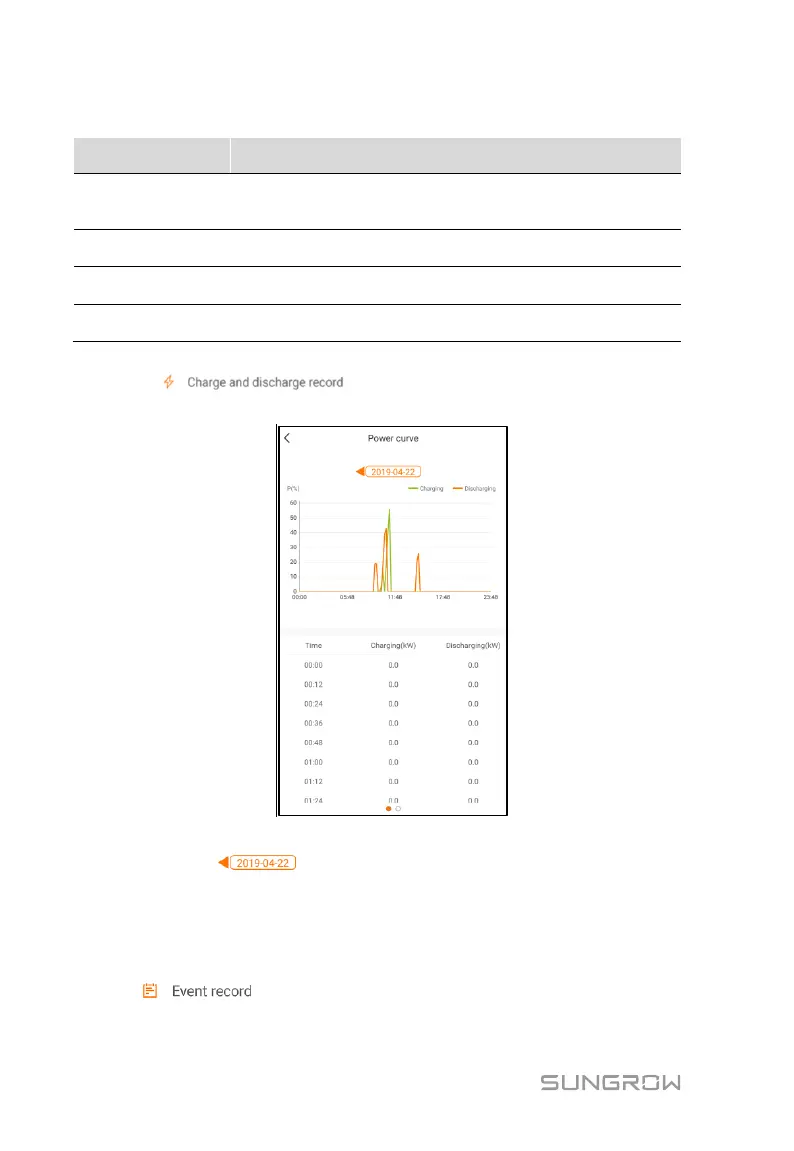
Click the “ ” to view the power curve page as shown in
following figure.
Fig. 8-10 Power curve
Tap the time bar on the top of the screen to select a time segment
and view the corresponding power curve.
Step 2 Swipe left to check the charge and discharge curve.
8.7.3 Event Records
Click " " to view event record list.