Calibration—434
e. Vertically center the display in the CRT viewing area
w ith the CH 1 POSITION control.
f. CHECK—CRT display for optimum risetime with
aberrations typically less than +2%, —2%, a total of 2%
peak to peak (+3%, —3%, total of 3% peak to peak if this
measurement is being made outside of the +20°C to +30°C
temperature range).
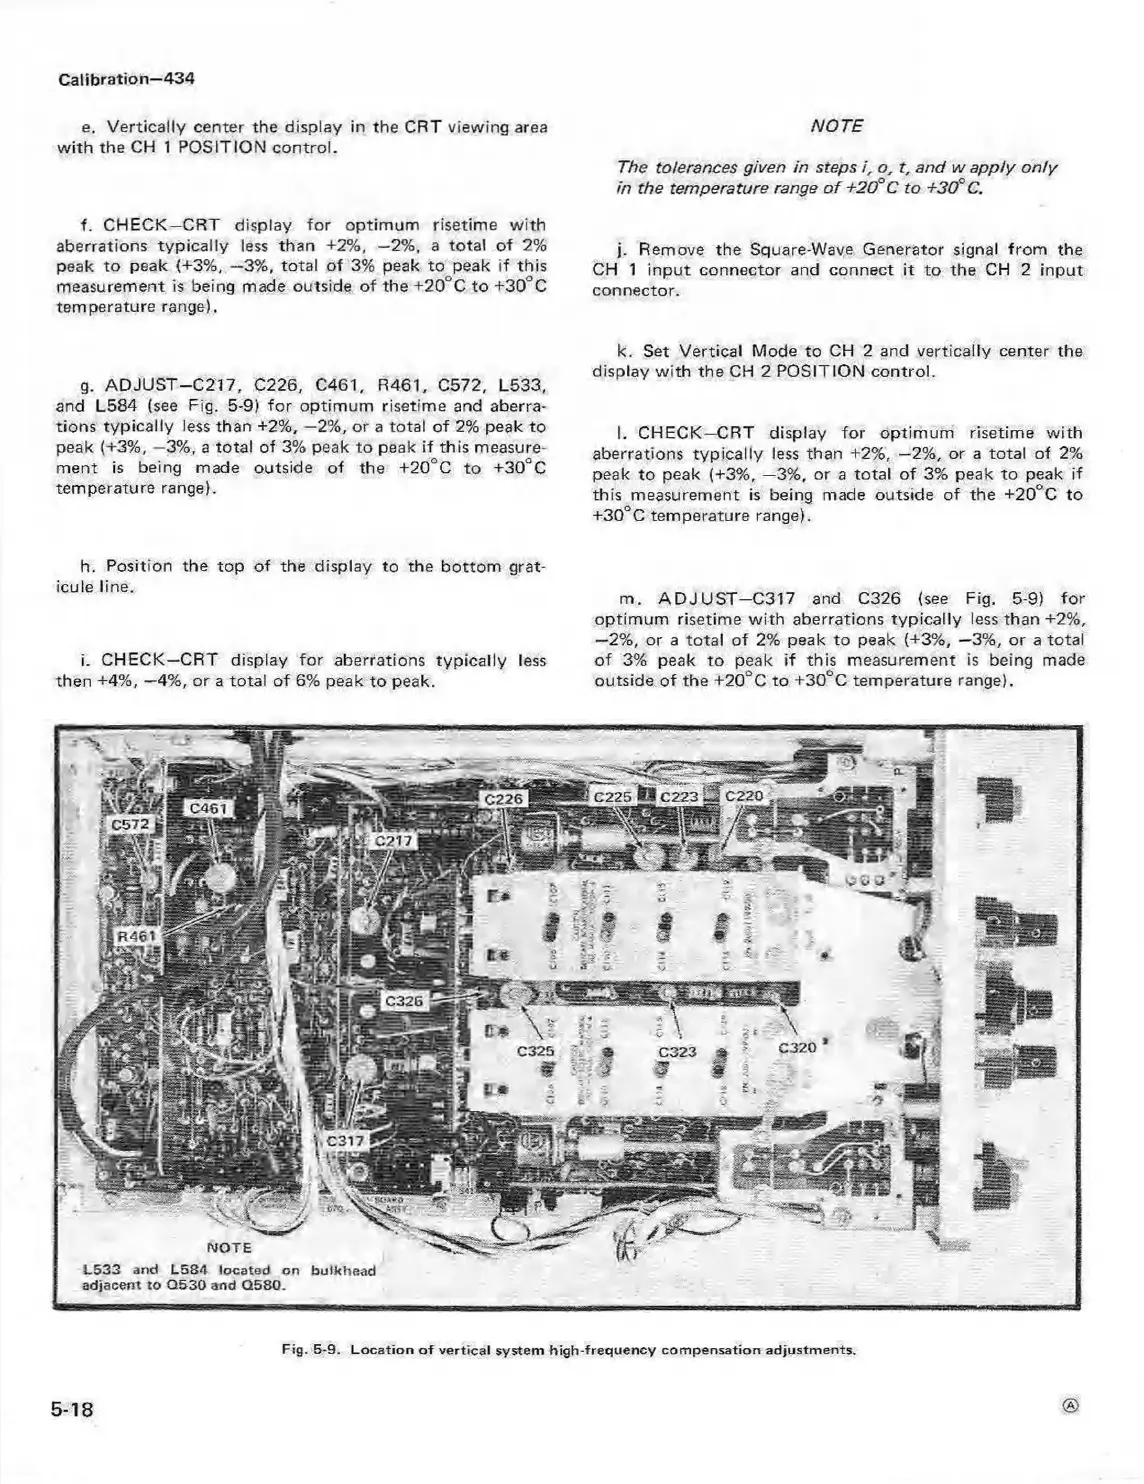
g. ADJUST—C217, C226, C461, R461, C572, L533,
and L584 (see Fig. 5-9) for optimum risetime and aberra
tions typically less than +2%, —2%, or a total of 2% peak to
peak (+3%, —3%, a total of 3% peak to peak if this measure
ment is being made outside of the +20°C to +30°C
temperature range).
h. Position the top of the display to the bottom grat
icule line.
i. CHECK—CRT display fo r aberrations typically less
then +4%, —4%, or a total of 6% peak to peak.
NOTE
The tolerances given in steps i, o, t, and w apply only
in the temperature range o f +20°C to +30°C.
j. Remove the Square-Wave Generator signal from the
CH 1 input connector and connect it to the CH 2 input
connector.
k. Set Vertical Mode to CH 2 and vertically center the
display w ith the CH 2 POSITION control.
I. CHECK—CRT display for optimum risetime w ith
aberrations typically less than +2%, —2%, or a total of 2%
peak to peak (+3%, —3%, or a total o f 3% peak to peak if
this measurement is being made outside of the +20 C to
+30°C temperature range).
m. A D JU S T —C317 and C326 (see Fig, 5-9) for
optimum risetime w ith aberrations typically less than +2%,
—2%, or a total of 2% peak to peak (+3%, —3%, or a total
of 3% peak to peak if this measurement is being made
outside of the +20° C to +30° C temperature range).
5-18
Fig. 5-9. Lo ca tion o f ve rtica l system high-frequency com pensation adjustm ents.