ACT6000 User Guide – January 2021 Page 19 of 52
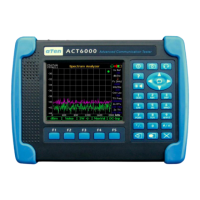
Test results (after about 90 seconds from the start)
During the test sequence it is shown step by
step that any single electric value can be
measured between a - b and c points.
For the low extraneous AC/DC Voltages * and
low Resistive Insulation (among a-b-c points)
are shown the worse values, as highlighted on
the image at left for the low insulation value
between a - b points.
All the transmissive measurements are only
between a - b points.
Under the “Subscriber” column, the estimated
values are shown (i.e. Far-end Noise* and
ADSL down stream estimation).
Once the automatic test is finished, push the F1 “Save” key to save the summarizing table
and all the hidden details (spectral / graphics responses included) on the internal memory.
By pushing the “Clear” key, it is possible to export the screen-shot to the USB Pen-
drive or PC in .BMP format.
* if found an extraneous voltage over 2.0 Volt, some measurements will be blocked !
Noise note: The results of the Noise RMS (local and remote estimation for the ADSL, ADSL2+ and
VDSL) are weighted with the right filters depending to the selected line service and masks (e.g. “G3”
for the ADSL2+).
Note: Pass/Fail indications
If some measured value is out of the preconfigured threshold limits the value will be shown in red.
- When the DC Capacitance value is abnormal (e.g. ≥ 700 nF ) and highlighted, it is probable that the
line is terminated with one or more telephones or similar POTS devices (due the ring capacitor)
- When the line length estimated by TDR is incongruent with the typical AC or DC line capacitance or
however it is out of the TDR range, the Line End, Ins. Loss and Bit-Rate results can be wrong and
will be highlighted in red.
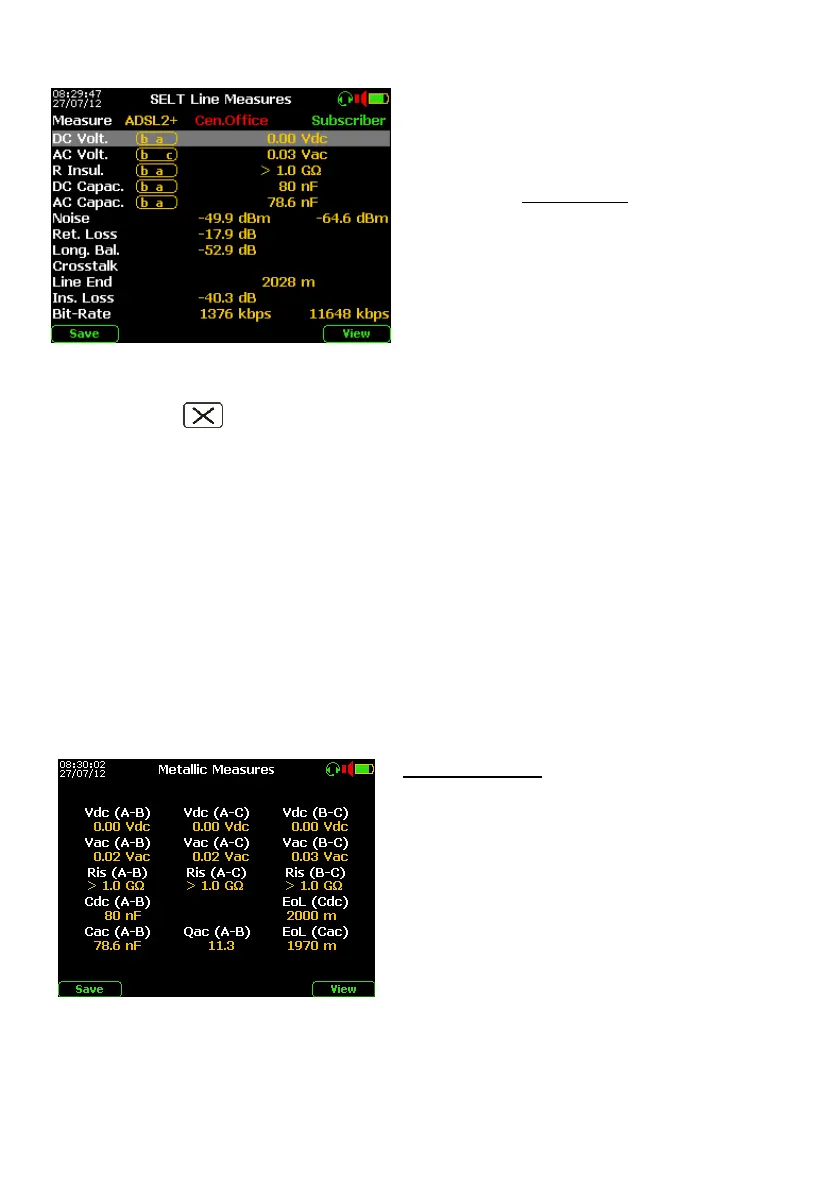
Details visualization
If Metallic Measure is selected on the previous
menu, pushing the F5 “View” key will open a
page where the detailed measured electric
values as at left shown:
- AC (as AC line power influence);
- DC Voltage, Resistive Insulation;
- DC and AC line Capacitance, both with
the estimated Line Length “EoL” related
to the previous setup on the “Config. &
Utility” menu.
By pushing arrow it is possible to view the graphs of other transmissive measurements,
as follows: