ACT6000 User Guide – January 2021 Page 29 of 52
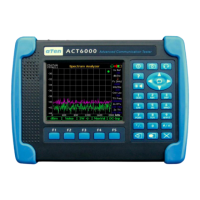
The TDR has captured a short positive trace from a
line interrupted for a short time.
This function is very useful to find and localize any
intermittent events on the line (short circuit, false
contacts or open circuit).
If necessary to measure the differential distance
between two envelopes, pushing the or
arrows into the Marker window, it is possible to
enable a second Marker and move it by the
arrows on the needed point.
To clear the second Marker it is sufficient push the
or arrows into the Marker window.
By repeated pushing of the F3 key and “Enter” the “long” pulse generally
used for medium/long ranges (over 500 meters) can be selected.
Selection of the “short” pulse is suggested for short ranges (under 500
meters).
In the cases of noisy or very long lines (over 4 km) it is possible to set the “Boost” pulse. It
is always recommended to limit the time this mode with a strong pulse is used to avoid
possible interference with adjacent lines.
By pushing the “Photo” key, the measurement can be temporarily frozen and the F5
key will be enabled to save the measurement in the internal memory.
By pushing the key the measurement will be reactivated.
By pushing the key the image on the display will export in BMP format on the USB
Pen-Drive or PC.
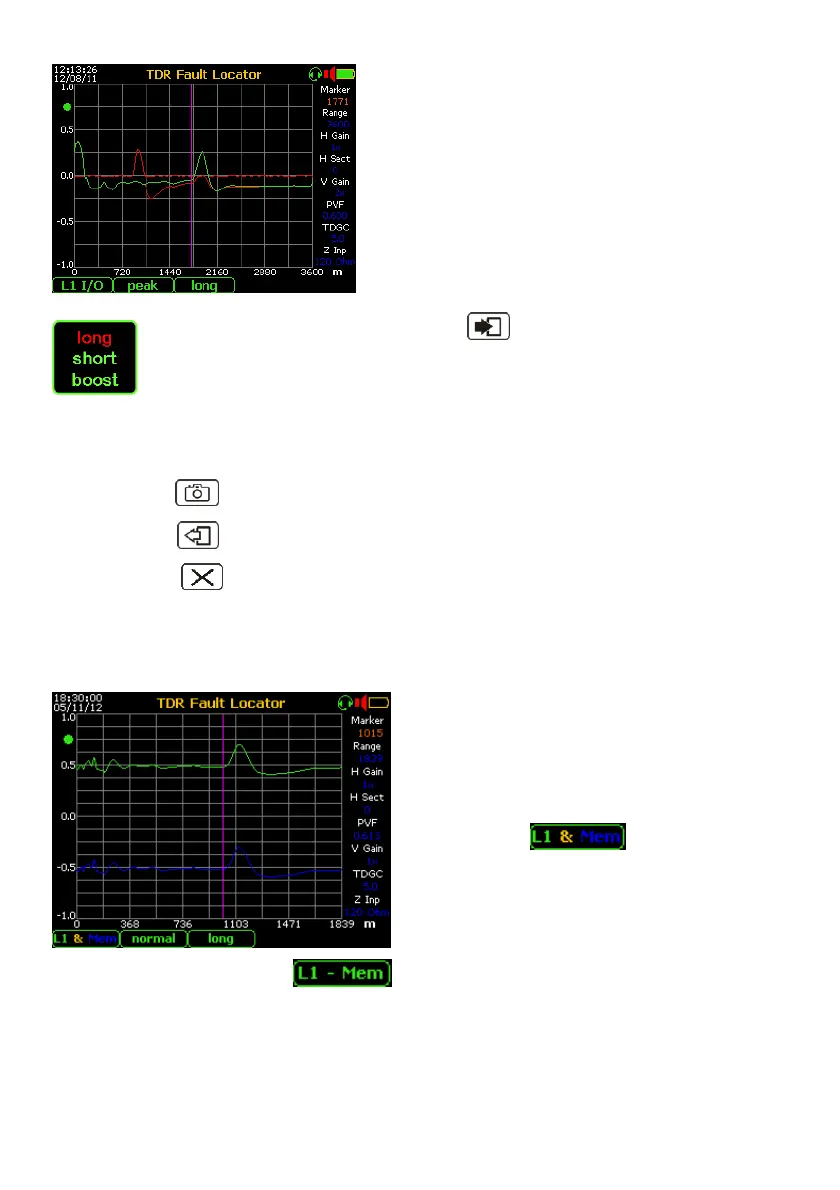
COMPARATIVE TEST
If desired to compare the real-time echogram with another one previously performed and
memorized, follow these instructions:
- From Main Menu enter with ”8. File
Manager” menu and select the test to be
compare, then push F5 key.
- Return on the Main Menu and enter with
”2 TDR Fault Locator” menu, by the F1
key select the mode.
As on the image at the left, will be shown
the real-time graph (top side and green)
and the old graph (bottom side and blue).
Selecting by the F1 key the modality, will be shown the differential graph
between the two echograms.