Debug Probes Hardware and Software
www.ti.com
20
SLAU647F–July 2015–Revised December 2016
Submit Documentation Feedback
Copyright © 2015–2016, Texas Instruments Incorporated
MSP Debuggers
5.6.5.3 MSP-FET HID Cold Boot
If the MSP-FET does not respond to software commands or firmware updates, a cold boot is the last
option to bring it back to operation. A cold boot is performed by connecting VBUS to the PUR signal of the
MSP-FET host device (MSP430F6638) with a serial resistor.
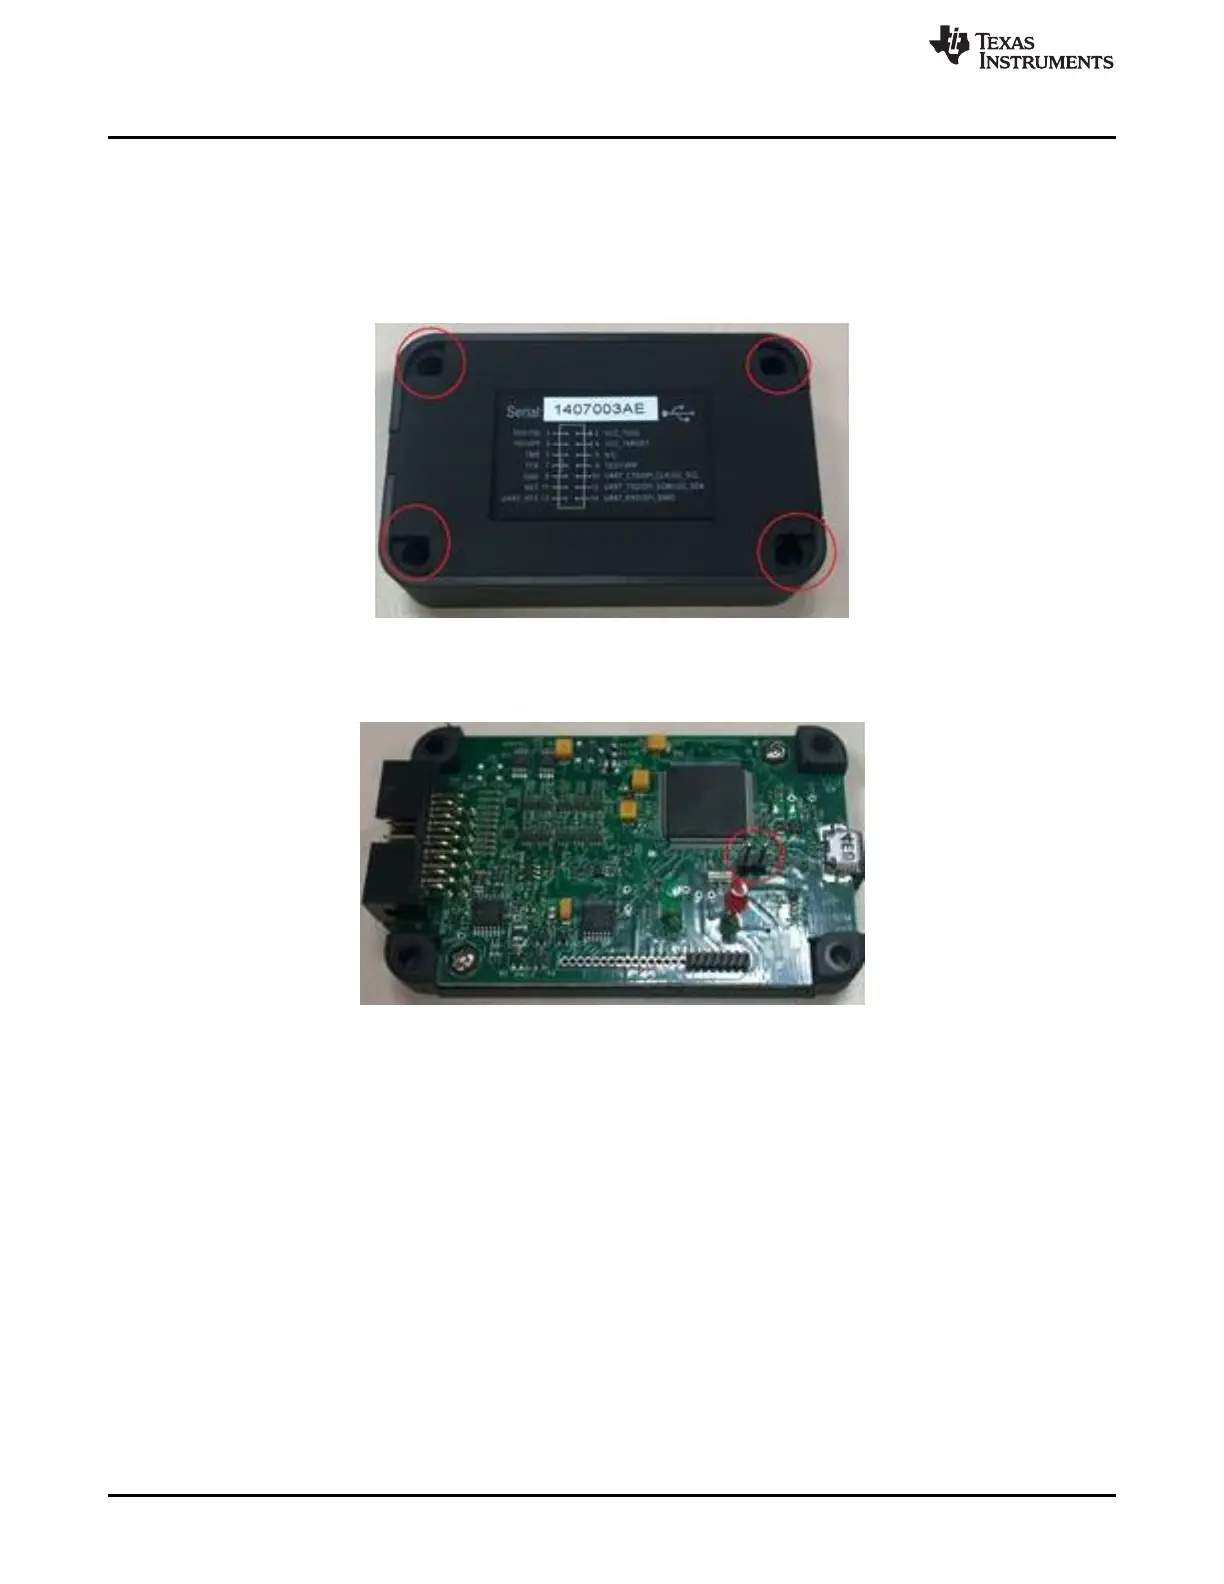
To execute this procedure, the MSP-FET cover must be opened by unscrewing the four screws on its
back (see Figure 13). Make sure that the USB cable is disconnected from the computer.
Figure 13. Open MSP-FET Cover
Next connect a cable or jumper to J5 (see Figure 14).
Figure 14. Jumper J5
Plug in the USB cable while the jumper is on J5. After boot, remove the jumper from J5. The MSP-FET is
recognized by the device manager of the OS as an HID-compliant device. Also, the green LED should be
on.
Start the IDE while the MSP-FET is in recovery (HID) mode. When prompted (see Figure 15), confirm the
request to recover the firmware and all following firmware update requests.
 Loading...