Chapter 6: Statistical Plots
115
7306ENG.DOC Statistical Plots and Analyses Julie Hewlett Revised: 05/29/98 3:52 PM Printed: 05/19/99 9:00 AM
Page 115 of 20
For the years 1978 -1984, determine in which baseball league,
North or South, the homerun leader tends to hit more home
runs. Use Scatter plots to find your solution.
Year Home Runs Year Home Runs
NORTH SOUTH NORTH SOUTH
1978 40 46 1982 37 39
1979 48 45 1983 40 39
1980 48 41 1984 36 43
1981 31 22
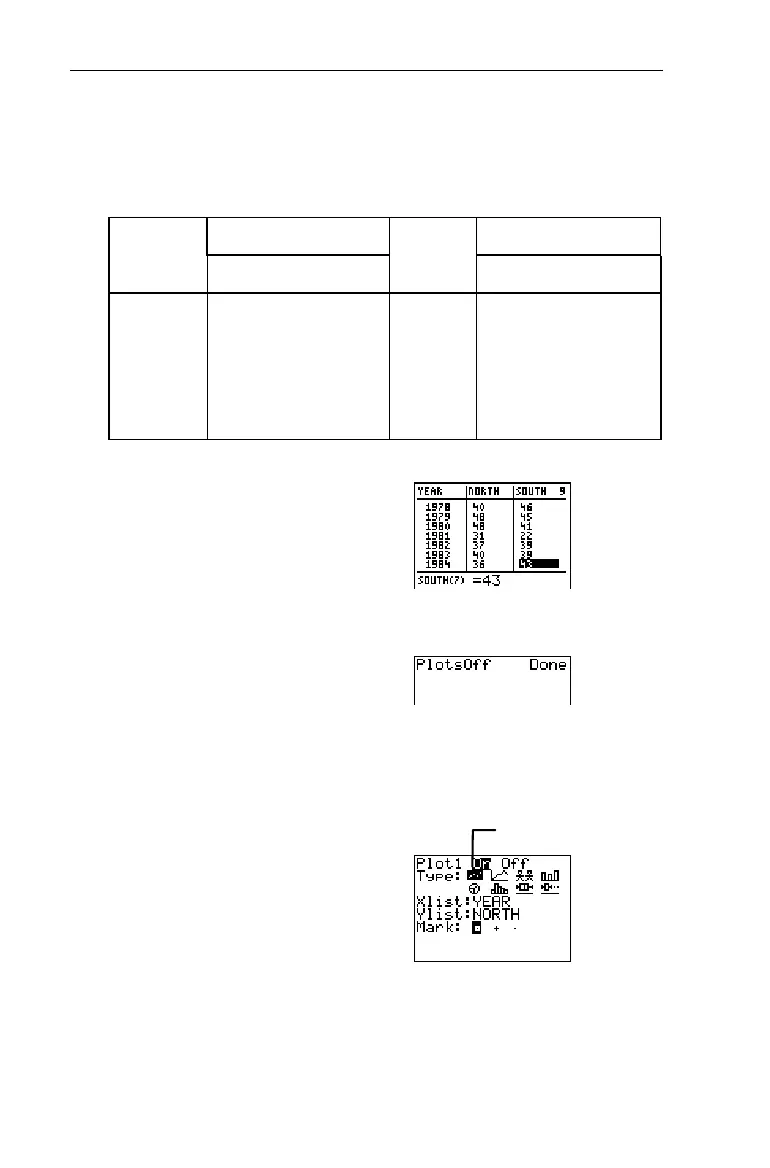
1. Create three lists in the List
editor,
YEAR
,
NORTH
, and
SOUTH
.
3
For more information on entering lists,
see Chapter 5: Lists.
2. Turn off all stat plots.
-e
4
b
3. Display the
STAT PLOTS
menu.
-e
4. Define
Plot1
as a Scatter
plot as shown to the right.
1
b#b#
-v
YEAR
b
#-v
NORTH
b#b
5. Display the
STAT PLOTS
menu.
-e
³
Select the
Ô
icon.
 Loading...