Chapter 6: Statistical Plots
119
7306ENG.DOC Statistical Plots and Analyses Julie Hewlett Revised: 05/29/98 3:52 PM Printed: 05/19/99 9:00 AM
Page 119 of 20
The
Xscl
WINDOW
value specifies the range of values for each
interval of a Bar graph. The
Yscl
WINDOW
value specifies the
height of a bar in a Bar graph; in other words, it acts as your
bar scale. To adjust
Xscl
and
Yscl
manually, press ' and
enter the new values with the number keys. For more
information about setting
WINDOW
values, see Chapter 9:
Function Graphing.
If you want the calculator to adjust the
WINDOW
values for you
automatically, press (
7:ZoomStat
.
Graph the data lists from the Scatter plot baseball example as
a vertical Bar graph (see that section in this chapter, if
necessary). Assign
¨
YEAR
as
CategList
,
¨
NORTH
as
DataList1
and
¨
SOUTH
as
DataList2
. Ignore
DataList3
. (By default,
L
3
is assigned
to
DataList3
, but if another list name is assigned you dont need
to change it.)
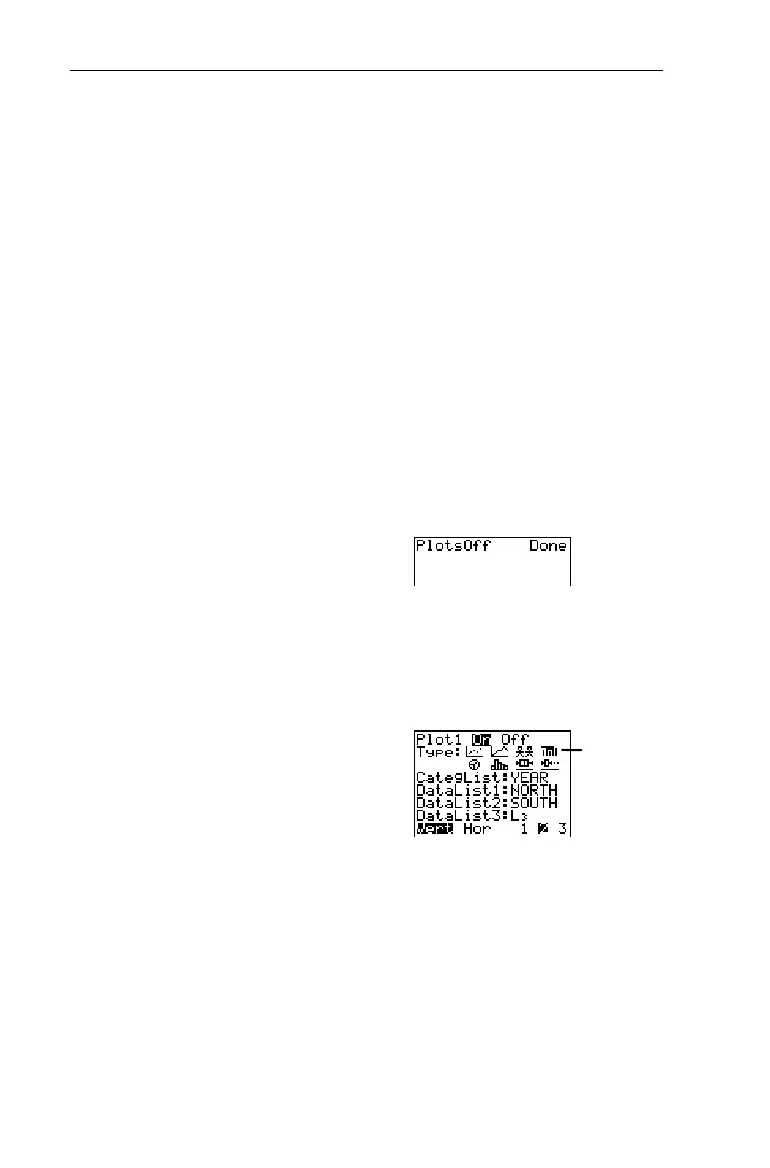
1. Turn off all stat plots.
-l:
-e
4
b
2. Display the
STAT PLOTS
menu.
-e
3. Define
Plot1
as a Bar graph
as shown to the right.
1
b#"""
b
4. Specify
CategList
,
DataList1
,
and
DataList2
.
#-v
YEAR
b#
-v
NORTH
b#-v
SOUTH
b
³
Select the
Ð
icon.
 Loading...