Sequence Graphing 346
Standard values (set when you select 6:ZoomStd from the „ Zoom toolbar menu) are:
You may need to change the standard values for the n and plot variables to ensure that
sufficient points are plotted.
To see how
plotstrt affects graph, look at the following examples of a recursive
sequence.
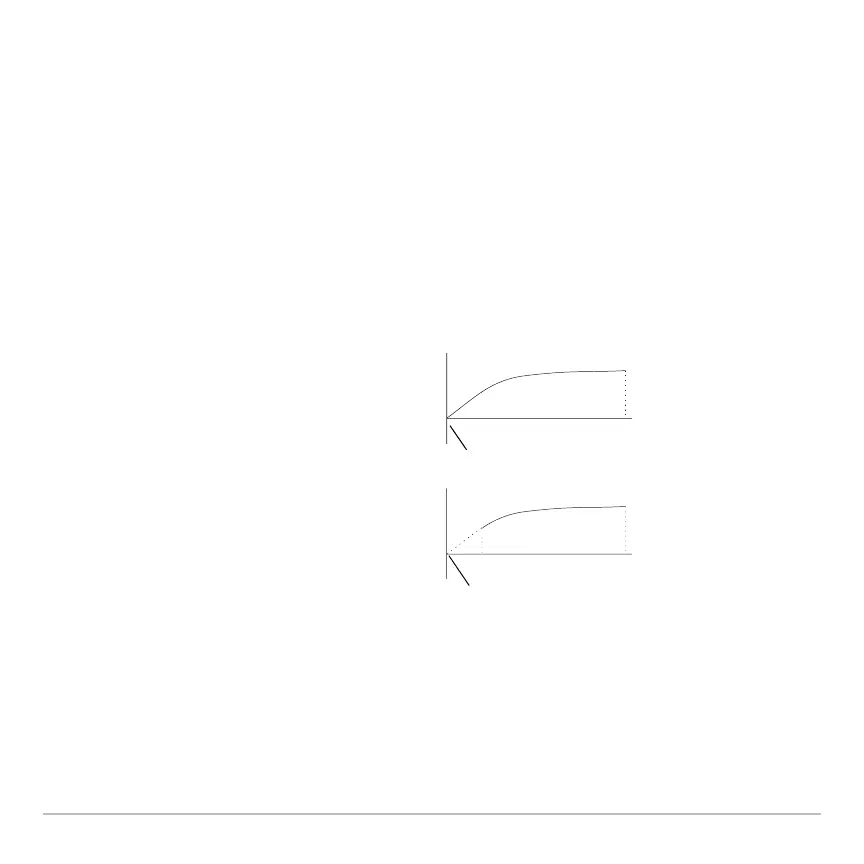
Note: Both of these graphs use the same Window variables, except for plotstrt.
nmin = 1.
nmax = 10.
plotstrt = 1.
plotstep = 1.
xmin =
L10.
xmax = 10.
xscl = 1.
ymin = L10.
ymax = 10.
yscl = 1.
This graph is plotted beginning with the 1st term.
This graph is plotted beginning with the 9th term.
plotStrt=1
plotStrt=9