Sequence Graphing 347
With TIME axes (from Axes on the Y= Editor), you can set plotstrt = 1 and still graph only
a selected part of the sequence. Simply define a viewing window that shows only the
area of the coordinate plane you want to view.
Changing the Graph Format
The Graph Order format is not available.
• With TIME or CUSTOM axes, multiple sequences are always plotted simultaneously.
• With WEB axes, multiple sequences are always plotted sequentially.
Exploring a Graph
As in function graphing, you can explore a graph by using the following tools. Any
displayed coordinates are shown in rectangular or polar form as set in the graph format.
You could set:
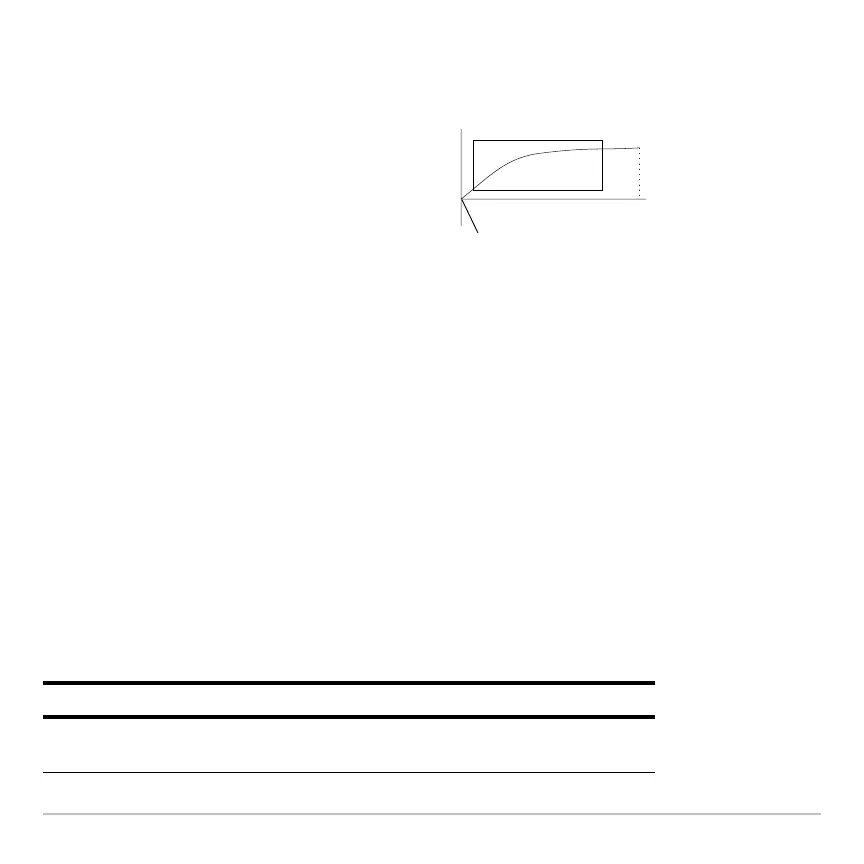
•
xmin = first n value to graph
•
xmax = nmax (although you can use other
values)
•
ymin and ymax = expected values for the
sequence
Tool For Sequence Graphs:
Free-Moving
Cursor
Works just as it does for function graphs.
plotStrt= nma