EasyManuals Logo

Texas Instruments TI-89 Titanium User Manual

Texas Instruments TI-89 Titanium
977 pages
To Next Page IconTo Next Page
To Previous Page IconTo Previous Page
Page #365 background imageLoading...
Page #365 background image
3D Graphing 362
Exploring the Graph
From the Graph screen, you can:
Trace the equation.
•Use the
Zoom toolbar menu to zoom in or out on a portion of the graph. Some of
the menu items are dimmed because they are not available for 3D graphs.
•Use the
Math toolbar menu to evaluate the equation at a specified point. Only
1:Value is available for 3D graphs.
You can also evaluate
z(x,y) while tracing. Type the x value and press ¸; then type
the y value and press ¸.
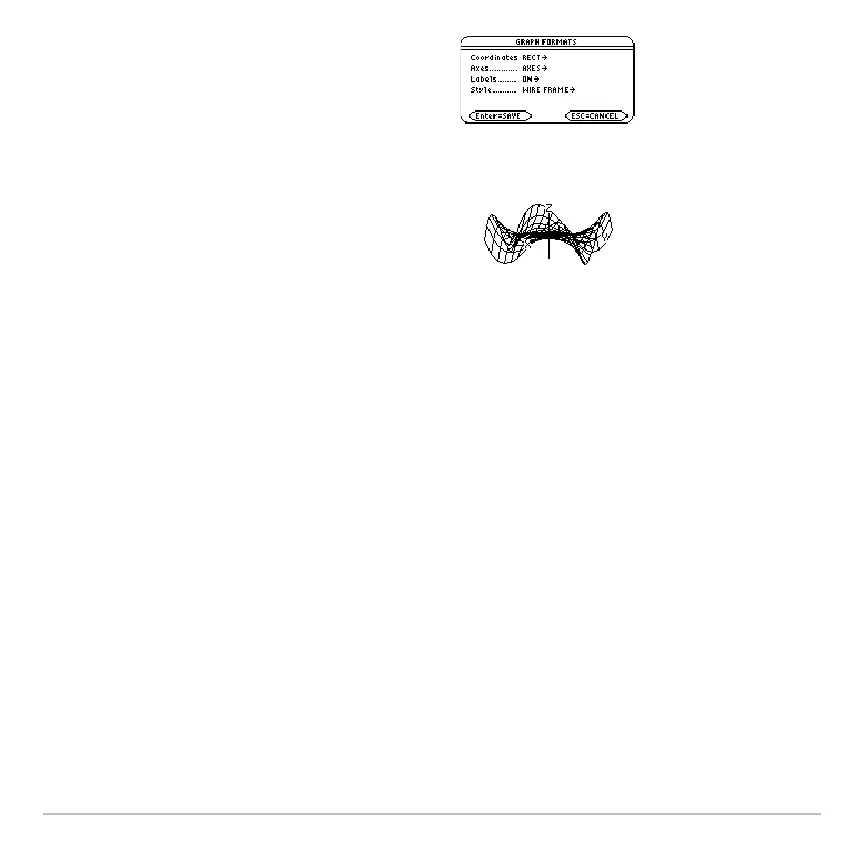
5. Change the graph format if necessary.
ƒ
9
– or -
8 Í
Note: To help you see the orientation of
3D graphs, turn on
Axes and Labels.
6. Graph the selected equations
(8%).
Note: Before displaying the graph, the
screen shows the “percent evaluated.”

Table of Contents

Other manuals for Texas Instruments TI-89 Titanium

Questions and Answers:

Question and Answer IconNeed help?

Do you have a question about the Texas Instruments TI-89 Titanium and is the answer not in the manual?

Texas Instruments TI-89 Titanium Specifications

General IconGeneral
Display TypeLCD
Display Resolution160 x 100 pixels
CPUMotorola 68000
CPU Speed16 MHz
RAM256 KB
Flash ROM2.7 MB
Programming LanguageTI-BASIC, Assembly
Power Source4 AAA batteries
ConnectivityI/O port
Dimensions7.5 x 3.5 x 1 inches

Related product manuals