EasyManuals Logo

Texas Instruments TI-89 Titanium User Manual

Texas Instruments TI-89 Titanium
977 pages
To Next Page IconTo Next Page
To Previous Page IconTo Previous Page
Page #366 background imageLoading...
Page #366 background image
3D Graphing 363
Differences in 3D and Function Graphing
This module assumes that you already know how to graph y(x) functions as described in
Basic Function Graphing. This section describes the differences that apply to 3D
equations.
Setting the Graph Mode
Use 3 to set
Graph = 3D before you define equations or set Window variables. The
Y= Editor and the Window Editor let you enter information for the current Graph mode
setting only.
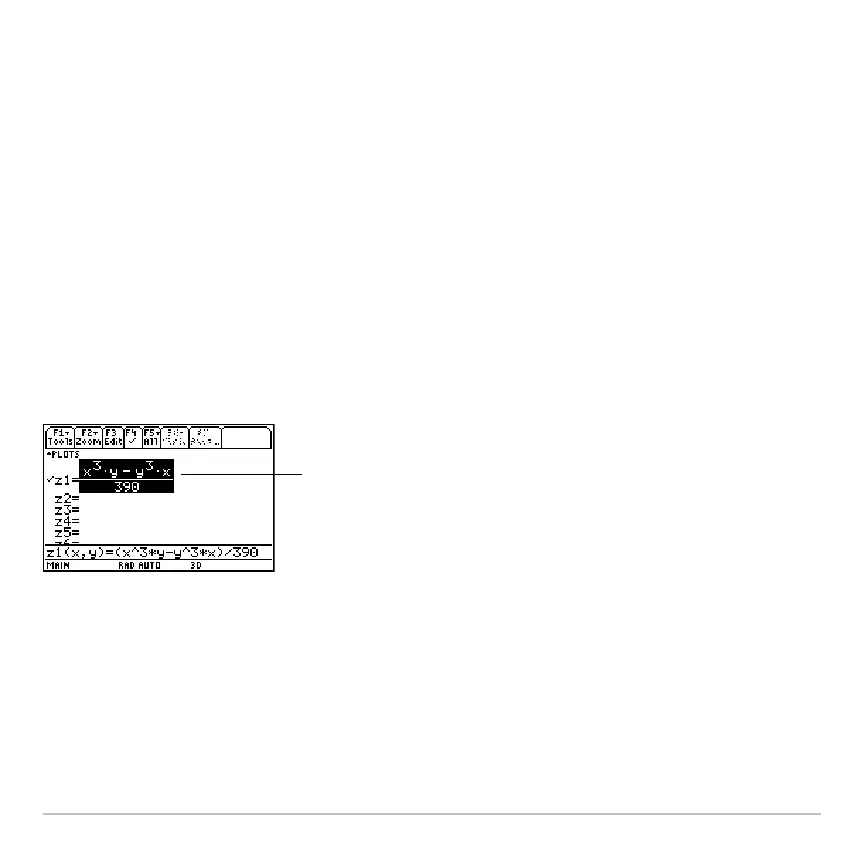
Defining 3D Equations on the Y= Editor
The Y= Editor maintains an independent function list for each Graph mode setting. For
example, suppose:
In FUNCTION graphing mode, you define a set of
y(x) functions. You change to 3D
graphing mode and define a set of
z(x,y) equations.
You can define 3D equations
for z1(x,y) through z99(x,y).

Table of Contents

Other manuals for Texas Instruments TI-89 Titanium

Questions and Answers:

Question and Answer IconNeed help?

Do you have a question about the Texas Instruments TI-89 Titanium and is the answer not in the manual?

Texas Instruments TI-89 Titanium Specifications

General IconGeneral
Display TypeLCD
Display Resolution160 x 100 pixels
CPUMotorola 68000
CPU Speed16 MHz
RAM256 KB
Flash ROM2.7 MB
Programming LanguageTI-BASIC, Assembly
Power Source4 AAA batteries
ConnectivityI/O port
Dimensions7.5 x 3.5 x 1 inches

Related product manuals