Statistics and Data Plots 546
Defining the Viewing Window
Stat plots are displayed on the current graph, and they use the Window variables that
are defined in the Window Editor.
Use 8 $ to display the Window Editor. You can either:
• Enter appropriate values.
— or —
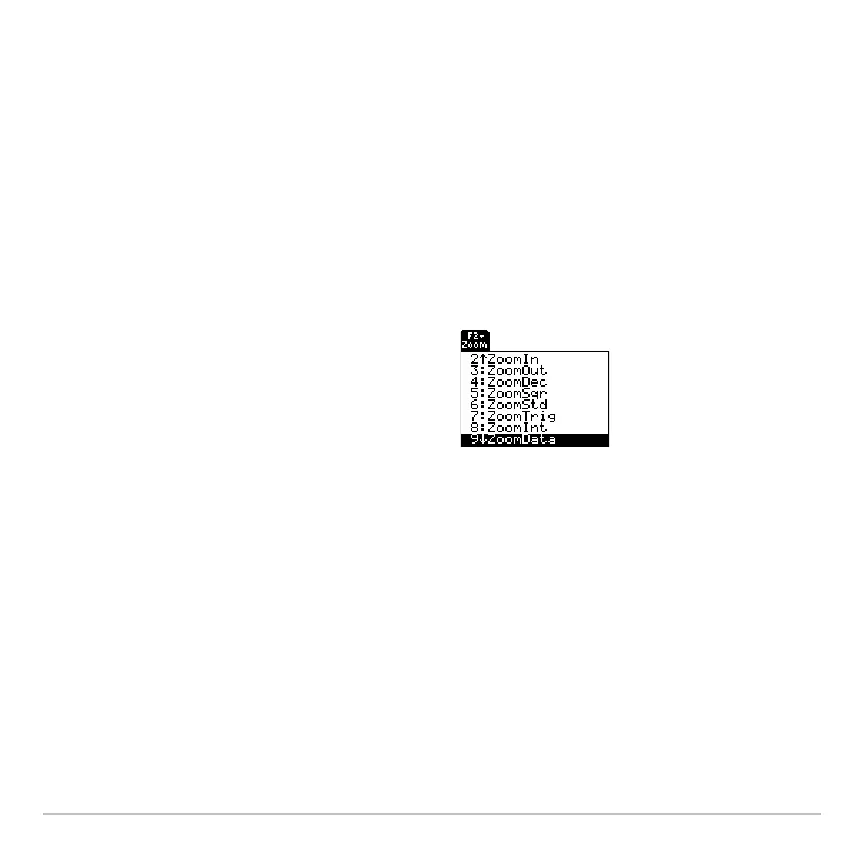
• Select
9:ZoomData from the „ Zoom toolbar menu. (Although you can use any
zoom,
ZoomData is optimized for st plots.)
Note: „ Zoom is available on the Y= Editor, Window Editor, and Graph screen.
ZoomData sets the viewing window to display
all statistical data points.
For histograms and box plots, only
xmin and
xmax are adjusted. If the top of a histogram is
not shown, trace the histogram to find the
value for
ymax.