Statistics and Data Plots 547
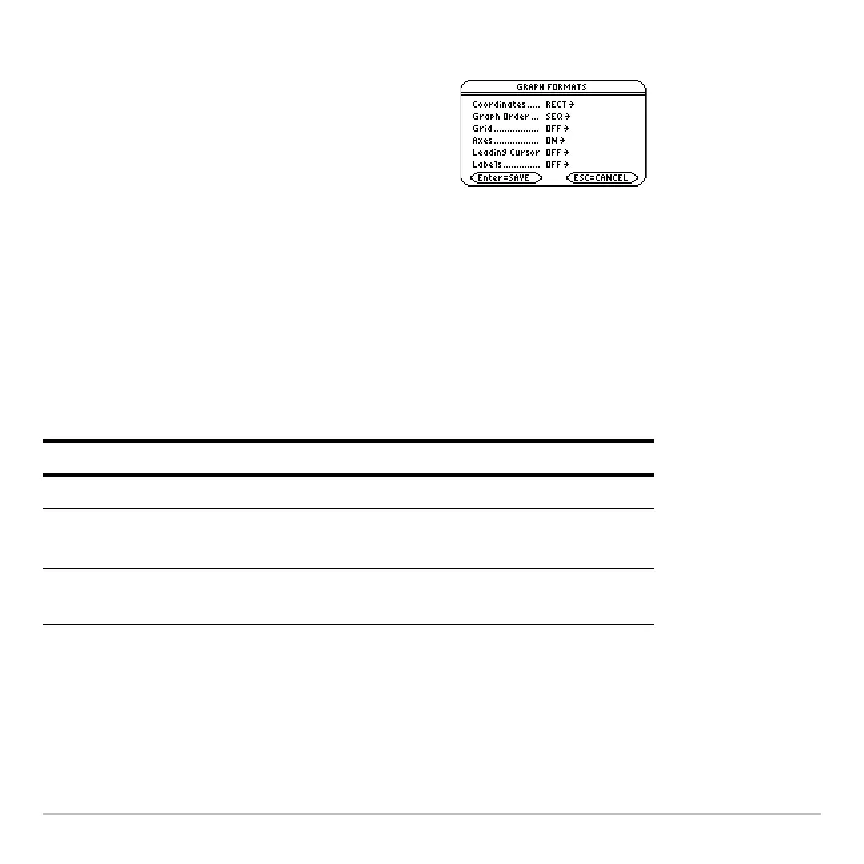
Changing the Graph Format
Tracing a Stat Plot
From the Graph screen, press … to trace a plot. The movement of the trace cursor
depends on the Plot Type.
Note: When a stat plot is displayed, the Graph screen does not automatically pan if you
trace off the left or right side of the screen. However, you can still press ¸ to center
the screen on the trace cursor.
Press:
,
9
— or —
@8 Í
from the Y= Editor, Window Editor, or Graph
screen.
Then change the settings as necessary.
Plot Type Description
Scatter or xyline Tracing begins at the first data point.
Box plot
Tracing begins at the median. Press
A to trace to Q1
and minX. Press
B to trace to Q3 and maxX.
Histogram The cursor moves from the top center of each bar,
starting from the leftmost bar.