© 2019 Thorlabs GmbH
5 Operating Instruction
32
Diagram Options
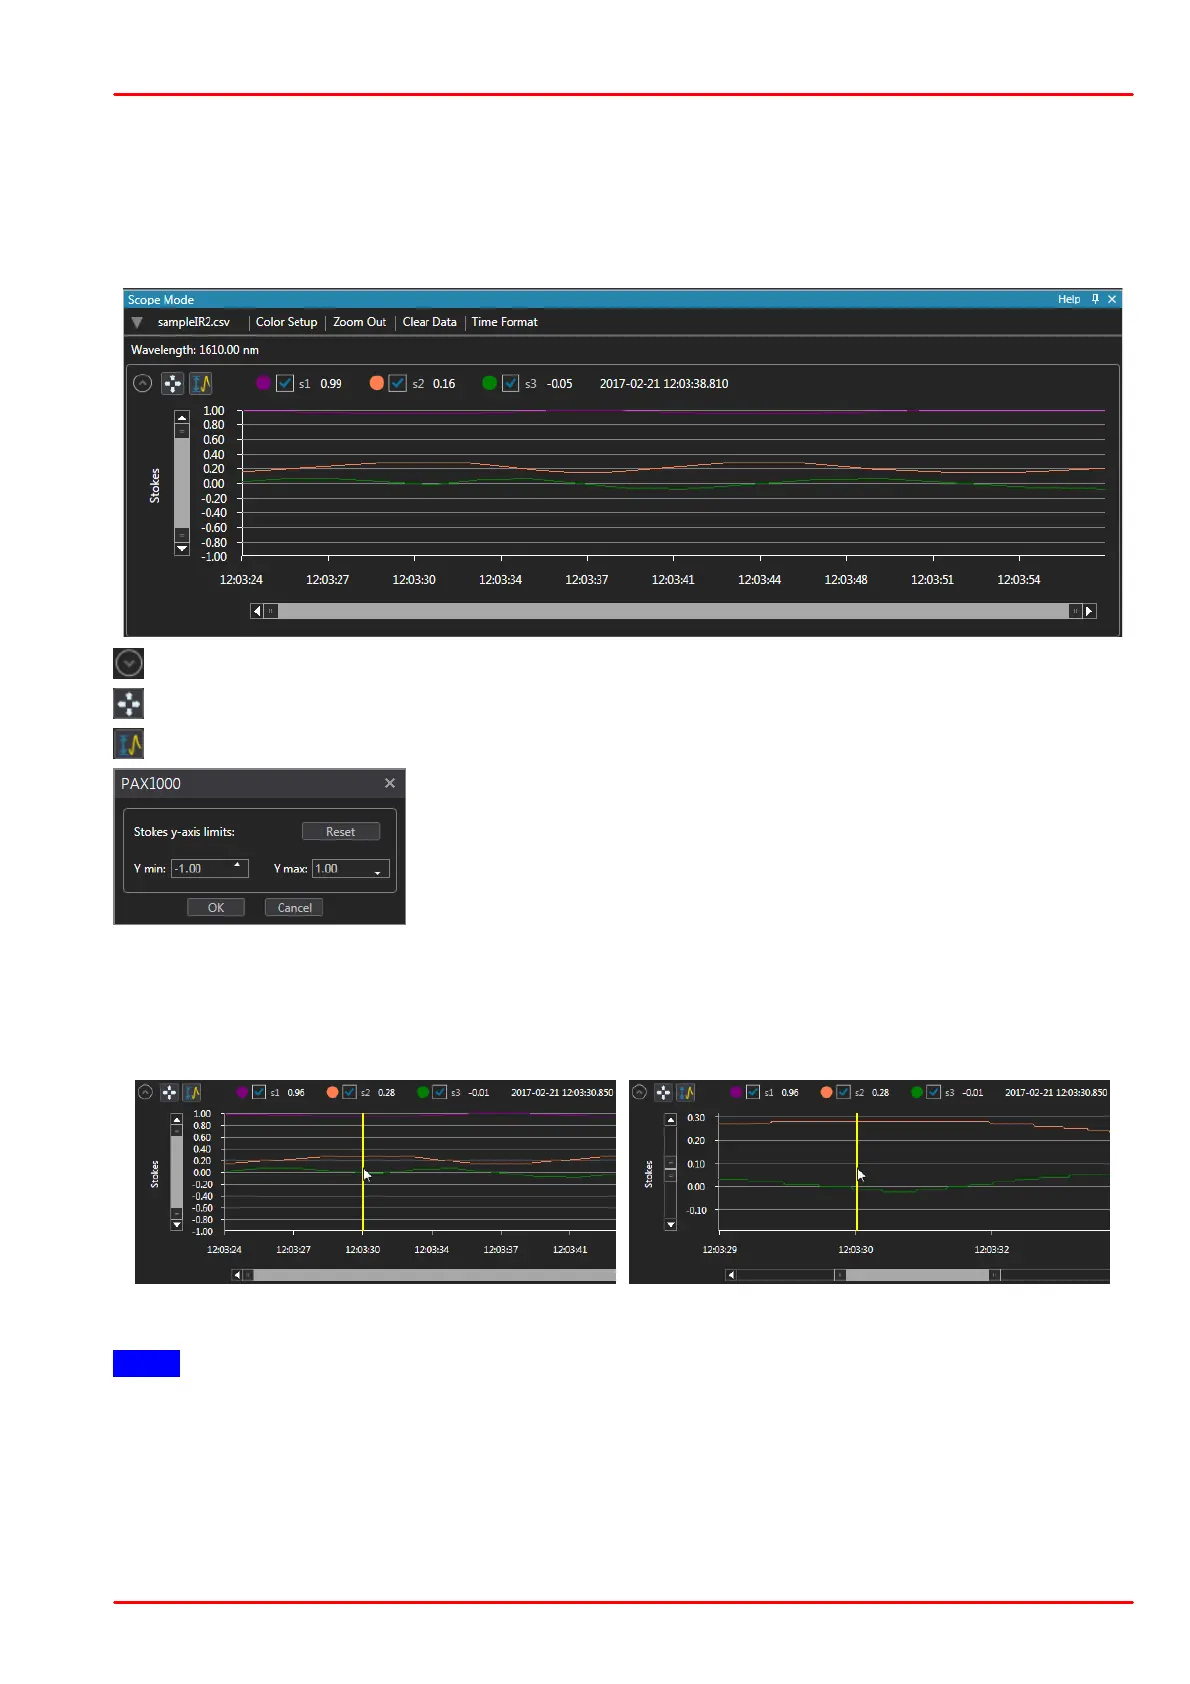
Each of the four diagrams can be modified for the best view. Additionally, for the first two dia-
grams (normalized Stokes vectors; ellipticity/azimuth) you can select the parameters to be dis-
played. The diagram options are explained below using the example of the Stokes vectors dia-
gram with a saved measurement loaded from a file.
Toggle the diagram view between expanded and collapsed.
Expand the diagram over the entire GUI window by hiding the other 3 charts.
Set the upper and lower limits of the Y scale:
Set the desired limits either by entering numerically or using the
up/down arrows.
Click OK to apply changes.
Click Reset to restore the scale limit to the maximum in accor-
dance with the actual parameter.
Zoom and Pan
Place the mouse pointer to the point in the diagram that you want to zoom in. A yellow marker
appears. Scroll the mouse wheel and the diagram will be zoomed in around the moose pointer
in both the Y and time scale directions:
Hover the mouse pointer over the diagram area ...
... and scroll the mouse wheel
Note
The yellow marker appears instantly when hovering the mouse over the diagram only if a load-
ed measurement is displayed.
In live mode, when the measurement of a PAX1000 is displayed, the yellow marker appears
only after the mouse wheel was rotated. Then the display of the current measurement is
paused and the diagram can be zoomed.

 Loading...


