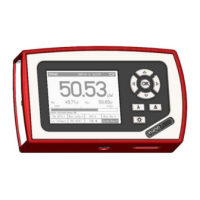
© 2019 Thorlabs GmbH31
PAX1000
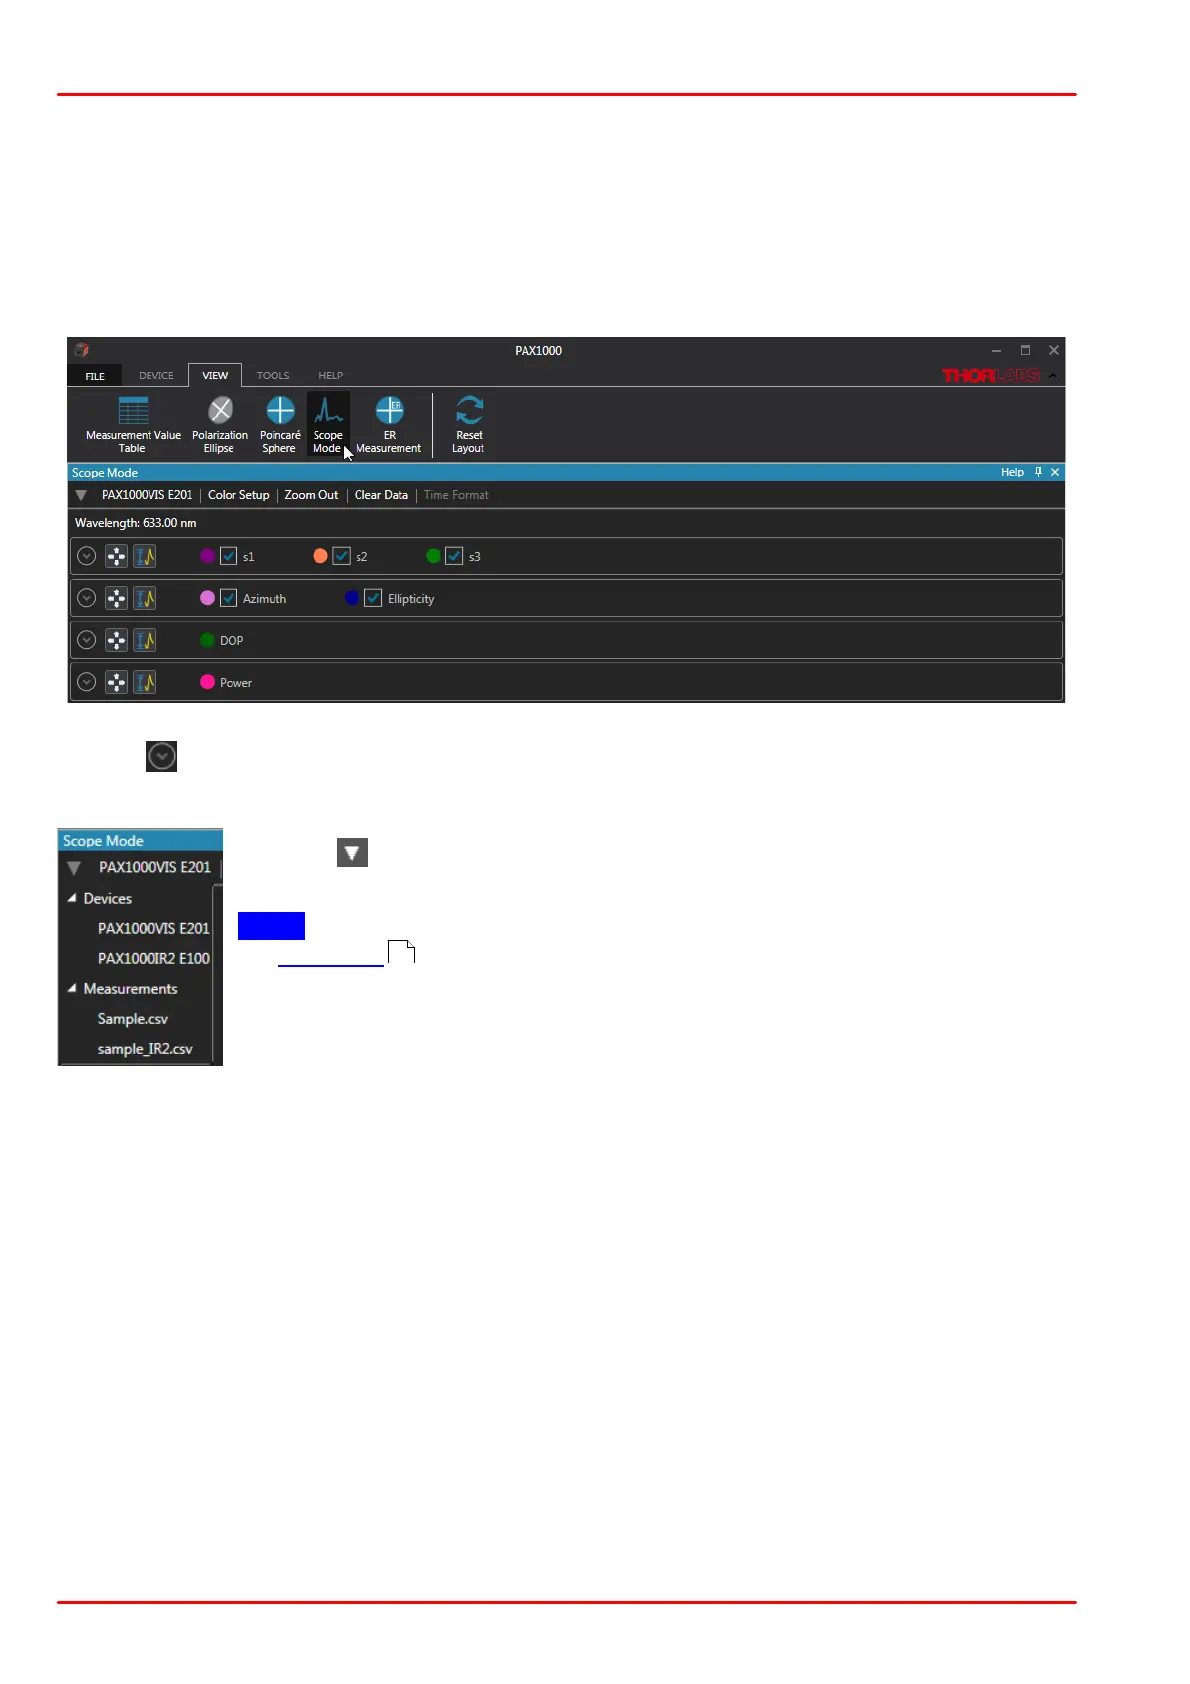
5.2.4 Scope Mode
In Scope Mode, the 1000 most recently measured polarization parameters are shown plotted
to a graph. The graph can be continuously updated as values are acquired. The data logging
· starts with the connection of a PAX1000 device
· restarts after pressing the Clear Data button.
Select from the View ribbon the item Scope Mode.
In the initial view shows four parameter groups, with the display of the scope graphs collapsed.
Use the icon to show the desired diagram.
Select Data Source
Click the icon and expand Devices and/or Measurements to select a data
source.
Note In order to select a saved measurement, it must be opened first from
the File menu !
Color Setup This menu assigns the color to the individual graphs. Select your preferred color.
Clear Data deletes the accumulated measurement value and restarts the display. The time axis
is then zoomed until the maximum of 1000 measurement values is reached. After reaching
1000 samples, the diagram shows the most recent 1000 samples, i.e., with each new sample,
the oldest is discarded, and the times axis shifts.
Time Format: If a measurement is loaded and selected for display, the time format can be
toggled between time stamp and elapsed time. For running measurements (a PAX1000 is se-
lected), only the time stamp is used.
17
 Loading...