© 2019 Thorlabs GmbH
5 Operating Instruction
42
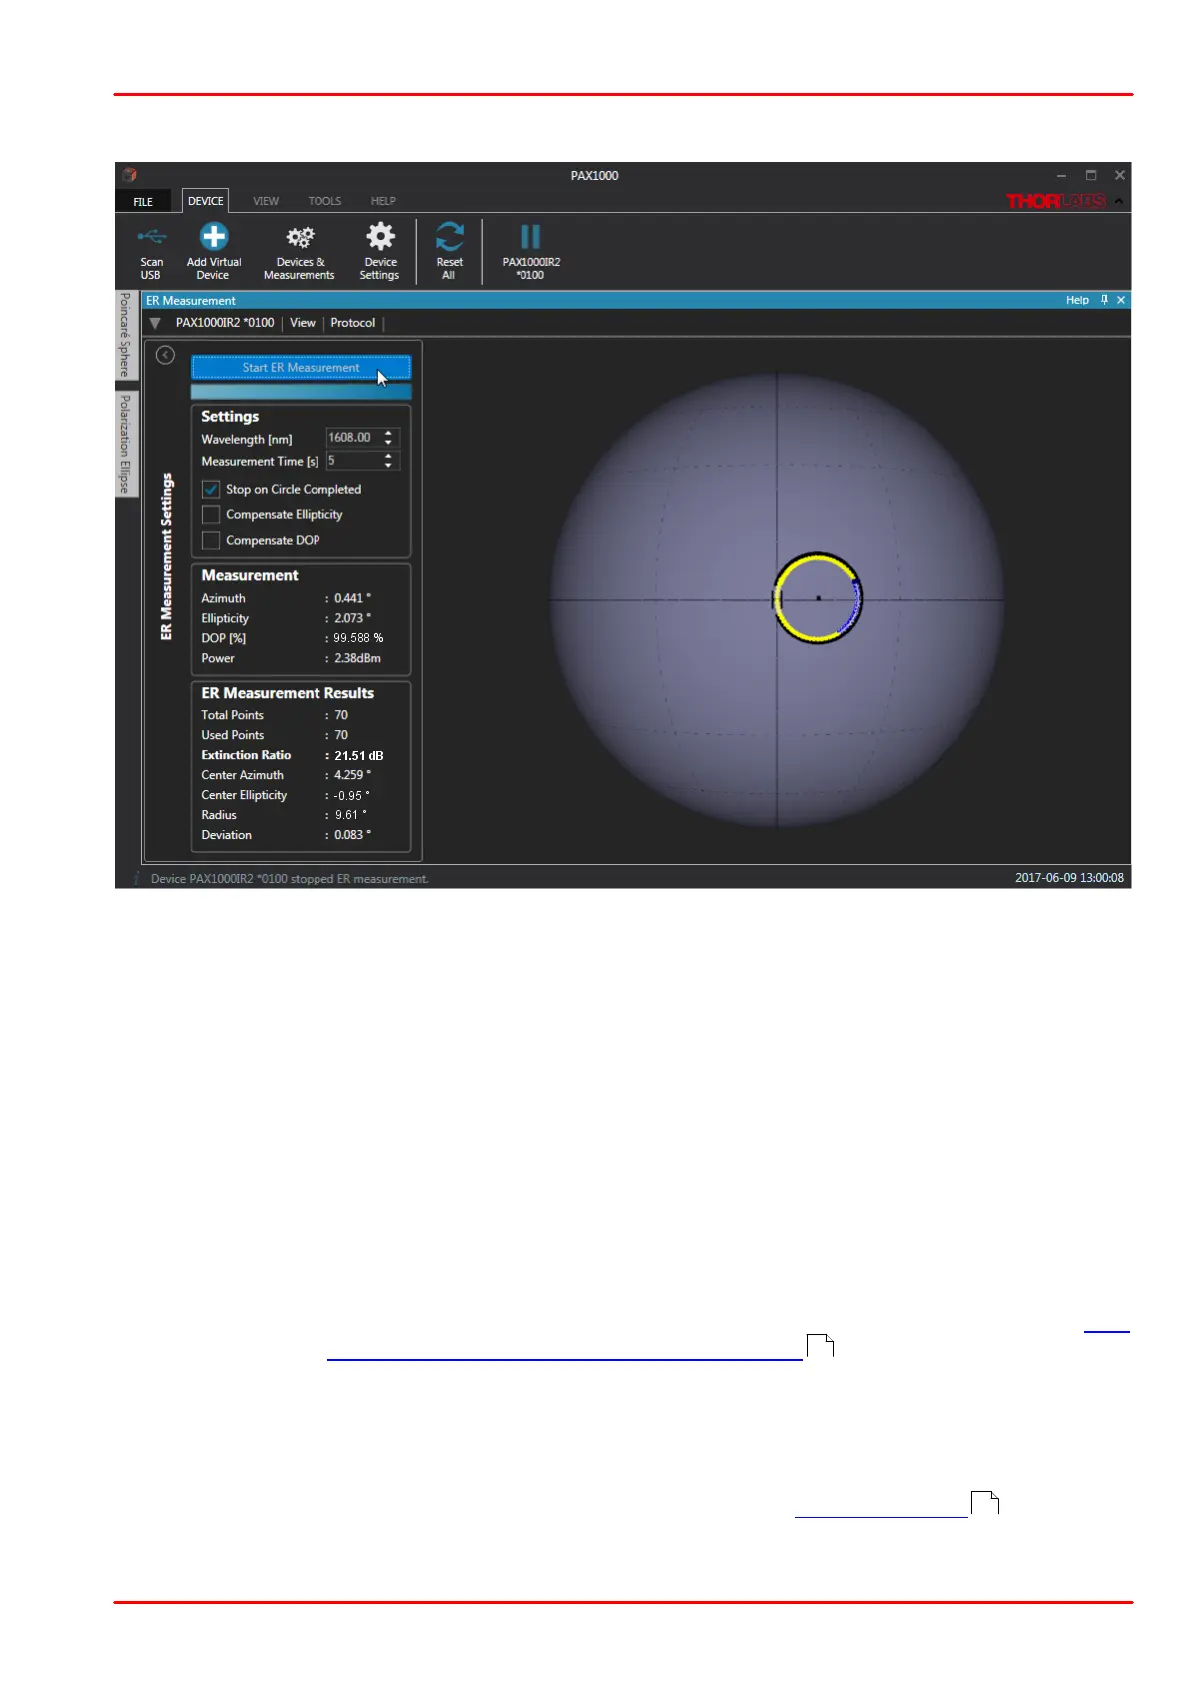
6. After finishing the measurement, the GUI will display the measurement results:
7. The yellow circle represents the measured states of polarization, while the black circle is the
approximation that is used for calculation of the ER.
Measurement Results
The box Measurement displays the parameters that were measured at the end of the ER
Measurement.
The box ER Measurement Results displays several parameters:
This is the total number of measured points (SOPs).
The software has an internal algorithm that excludes points located too
close to each other from the total number of measured points. The remain-
ing points are used for circle approximation and subsequently for ER calcu-
lation.
Measurement result is displayed with respect to the state of the check
boxes Compensate Ellipticity and Compensate DOP. For detailed ex-
planations and examples of these compensations, please see section Cor-
rection of the Polarimeter ER Measurements in the Tutorial.
Azimuth angle of the center of the calculated circle.
Ellipticity angle of the center of the calculated circle.
Radius of the calculated circle in ° on the Poincaré Sphere.
Standard deviation of the Used Points from the approximated circle.
If a warning or an error message appears, please see section Troubleshooting for possible
reasons and solution proposals.
75
52

 Loading...


