© 2007-2012 Thorlabs GmbH
25Description
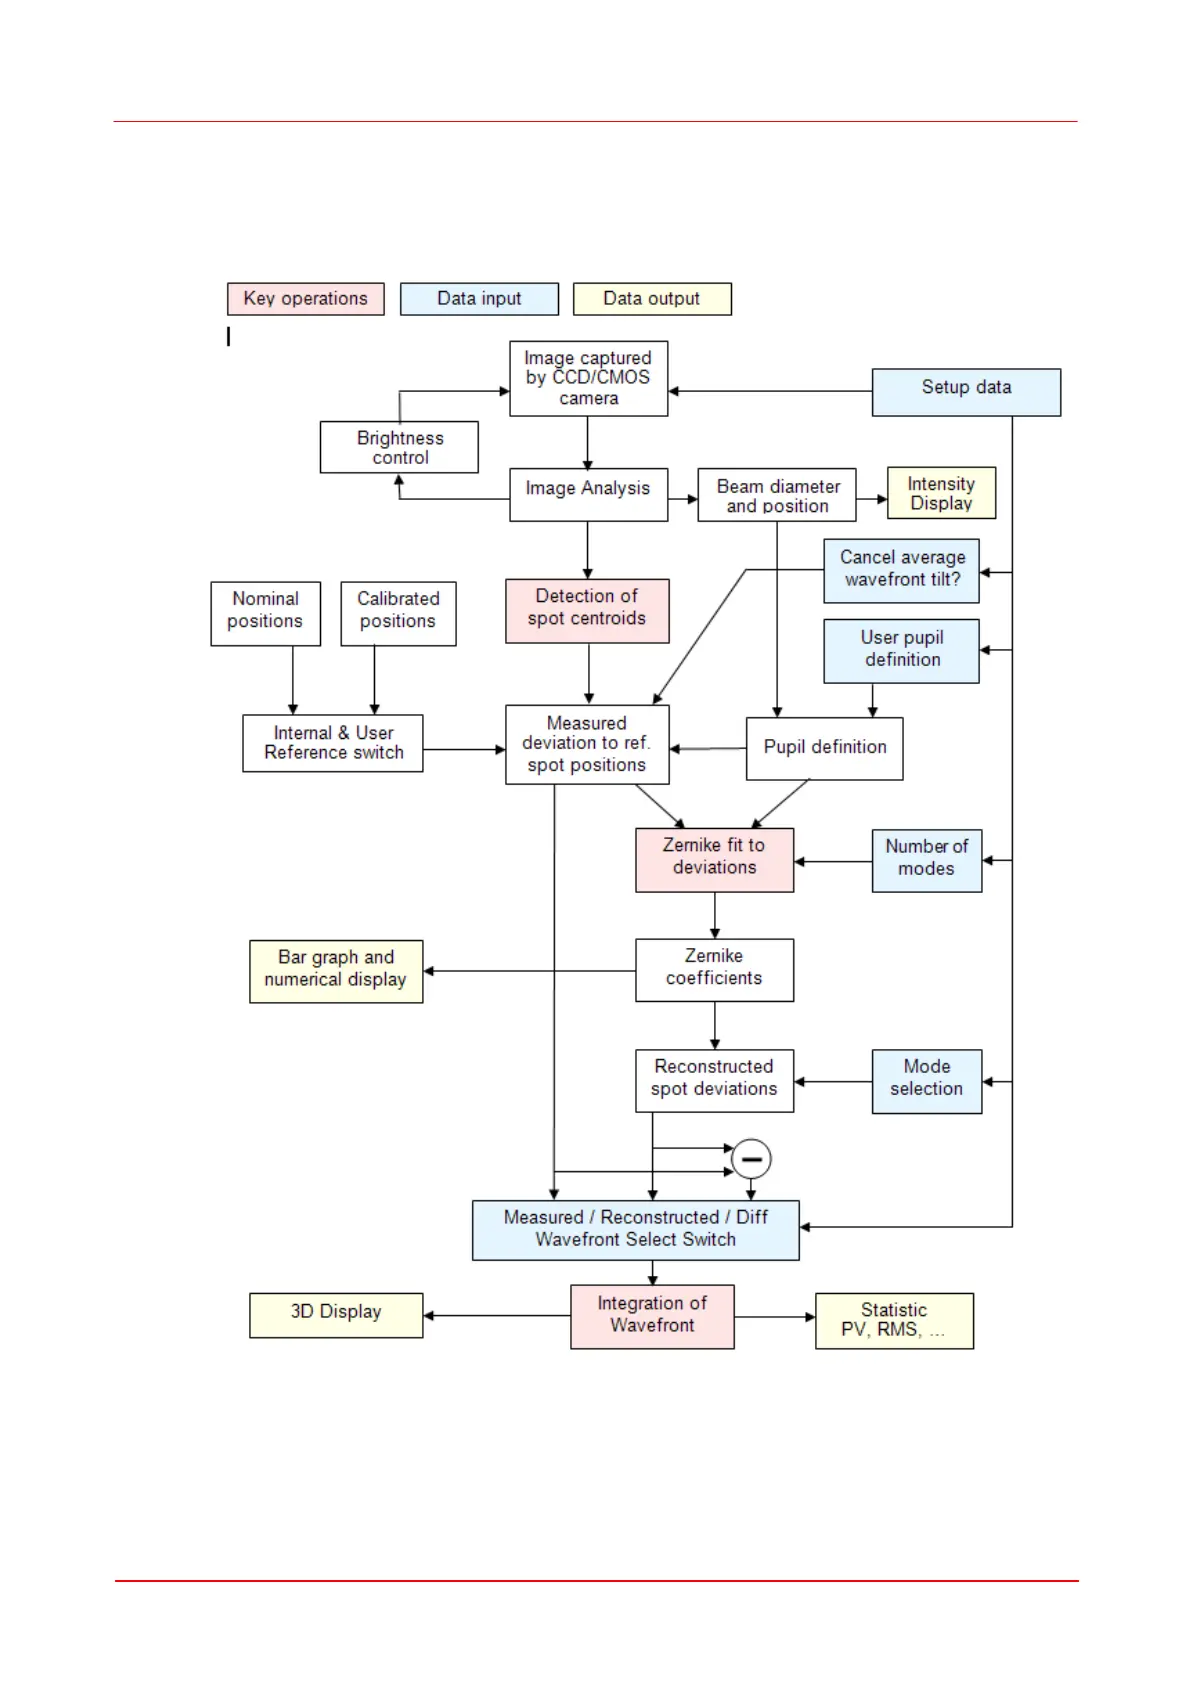
Data flow chart
The following chart will give an overview that shows the data flow within the
Wavefront Sensor software and also point out user defined inputs and data outputs.
The brightness of the camera image is controlled within a loop to ensure an optimal
saturation level. Diameter and position of the beam is detected and these data are
used optionally for defining the instruments pupil area. Otherwise pupil data can be
defined by the user.
 Loading...