© 2007-2012 Thorlabs GmbH
50 WFS Series
4.2.2.2
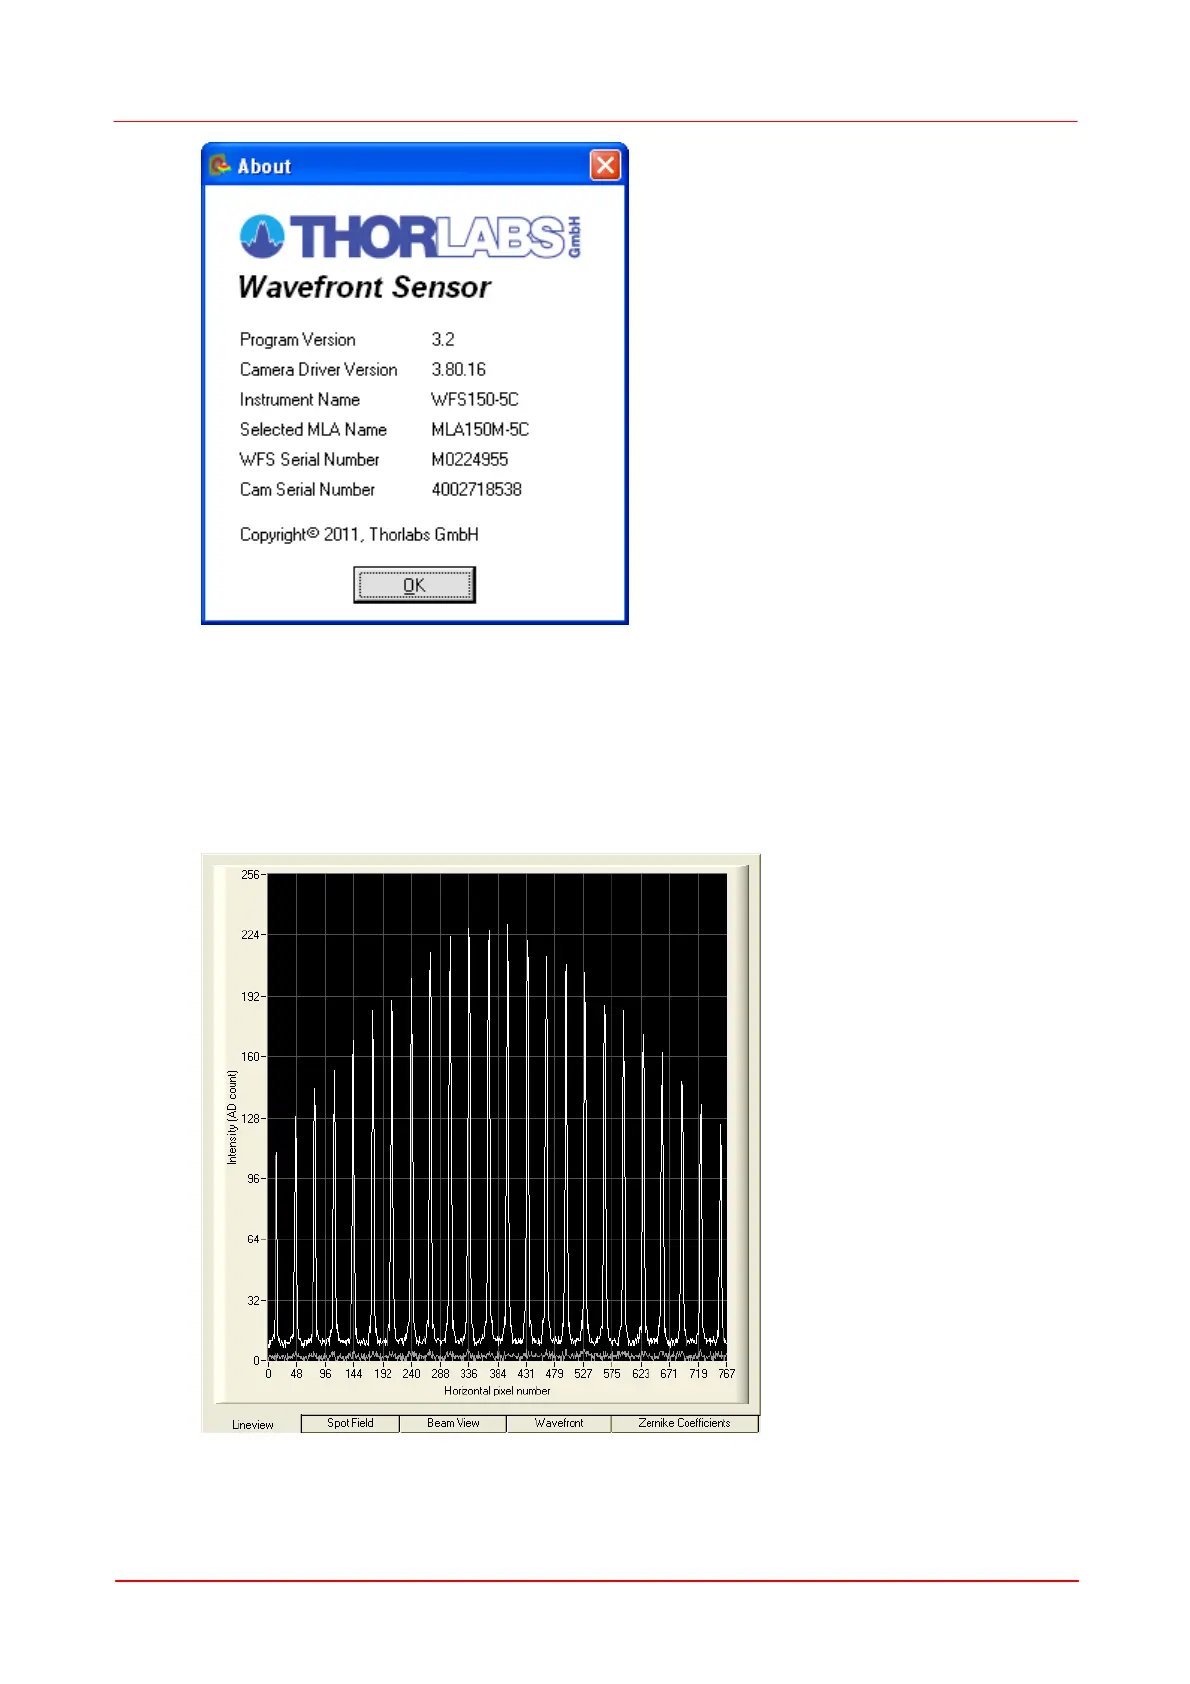
Lineview Panel
This graph displays the horizontal intensity distribution of the CCD/CMOS camera.
Each point on the horizontal axis of the diagram correspond to one column of the
CCD/CMOS array and displays both the minimum (gray, at the bottom) and the
maximum intensity level (white) of the entire pixel column. The peaks are due to the
focusing ability of the lenslet array that concentrate the intensity within small spots.
This graph is useful to check the power level of the analysed beam, especially when
 Loading...