© 2007-2012 Thorlabs GmbH
62 WFS Series
'Gray scale' switched between a color spectrum and a graduated gray color
palette
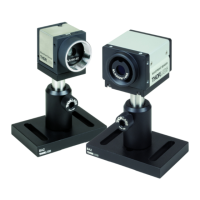
'Contour' inserts contour lines into the graph indicating lines of equal
wavefront height
'Hide z axis' hides the z-axis and the corresponding grid and caption
'2D Projection' let the 3D graph collapse to the base x-y plane
The following items define the view of the 3D graph
'Longitude' determines the rotation angle about the z axis
'Latitude' determines the view angle to the graph
'Zoom' changes the graph size (range 1...10)
Clicking Default 3D View adjusts all controls to the default 3D view whereas
Default Top View rotated the graph to achieve a top view of the profile. The default
top view zoom level of 2 is to visualize the entire active sensor area without its
caption.
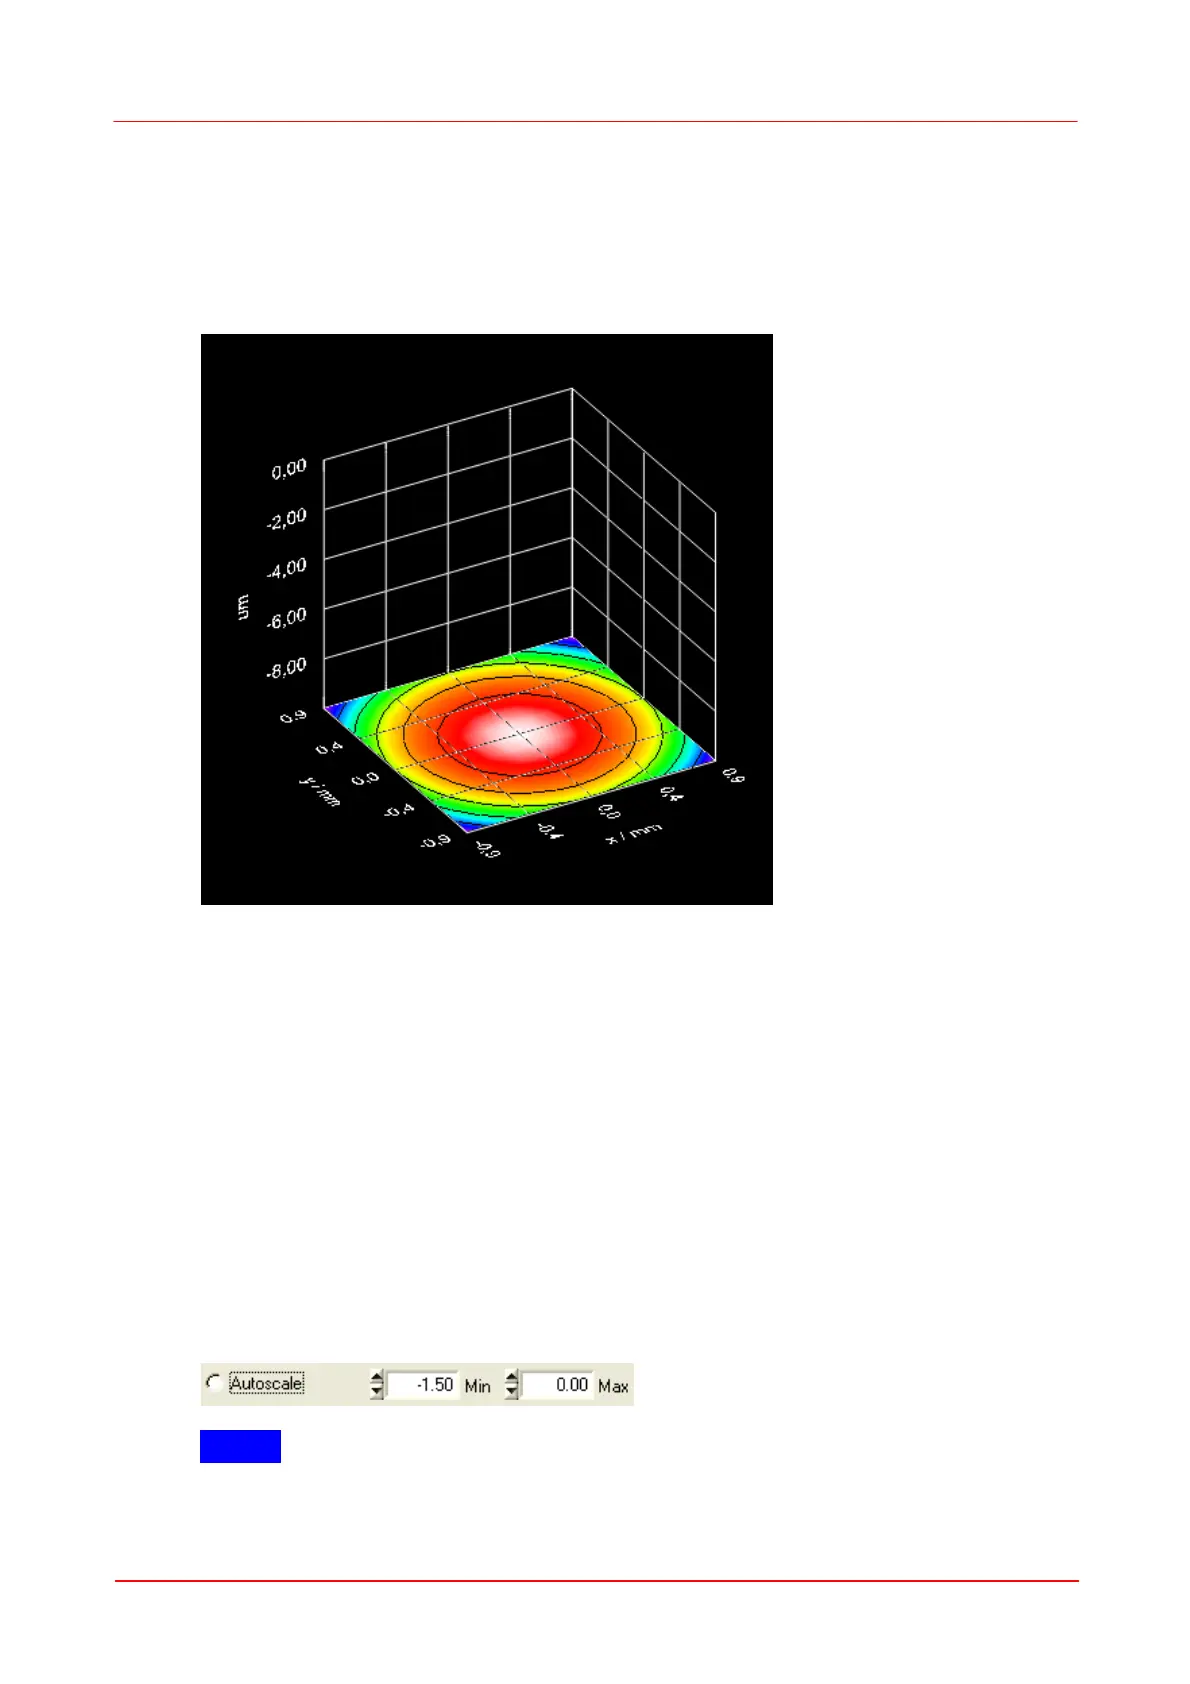
Autoscale
By default, the graph's z-axis is auto scaled to utilize the full diagram heights,
independent of the wavefront dynamic.
Switch the 'Autoscale' option off to enter manually defined values for the displayed
range of the z-axis.
NOTE
The absolute position of the wavefront surface with respect to the z-axis is
 Loading...