10. Application Examples
Page 51
Status: 5.12.17
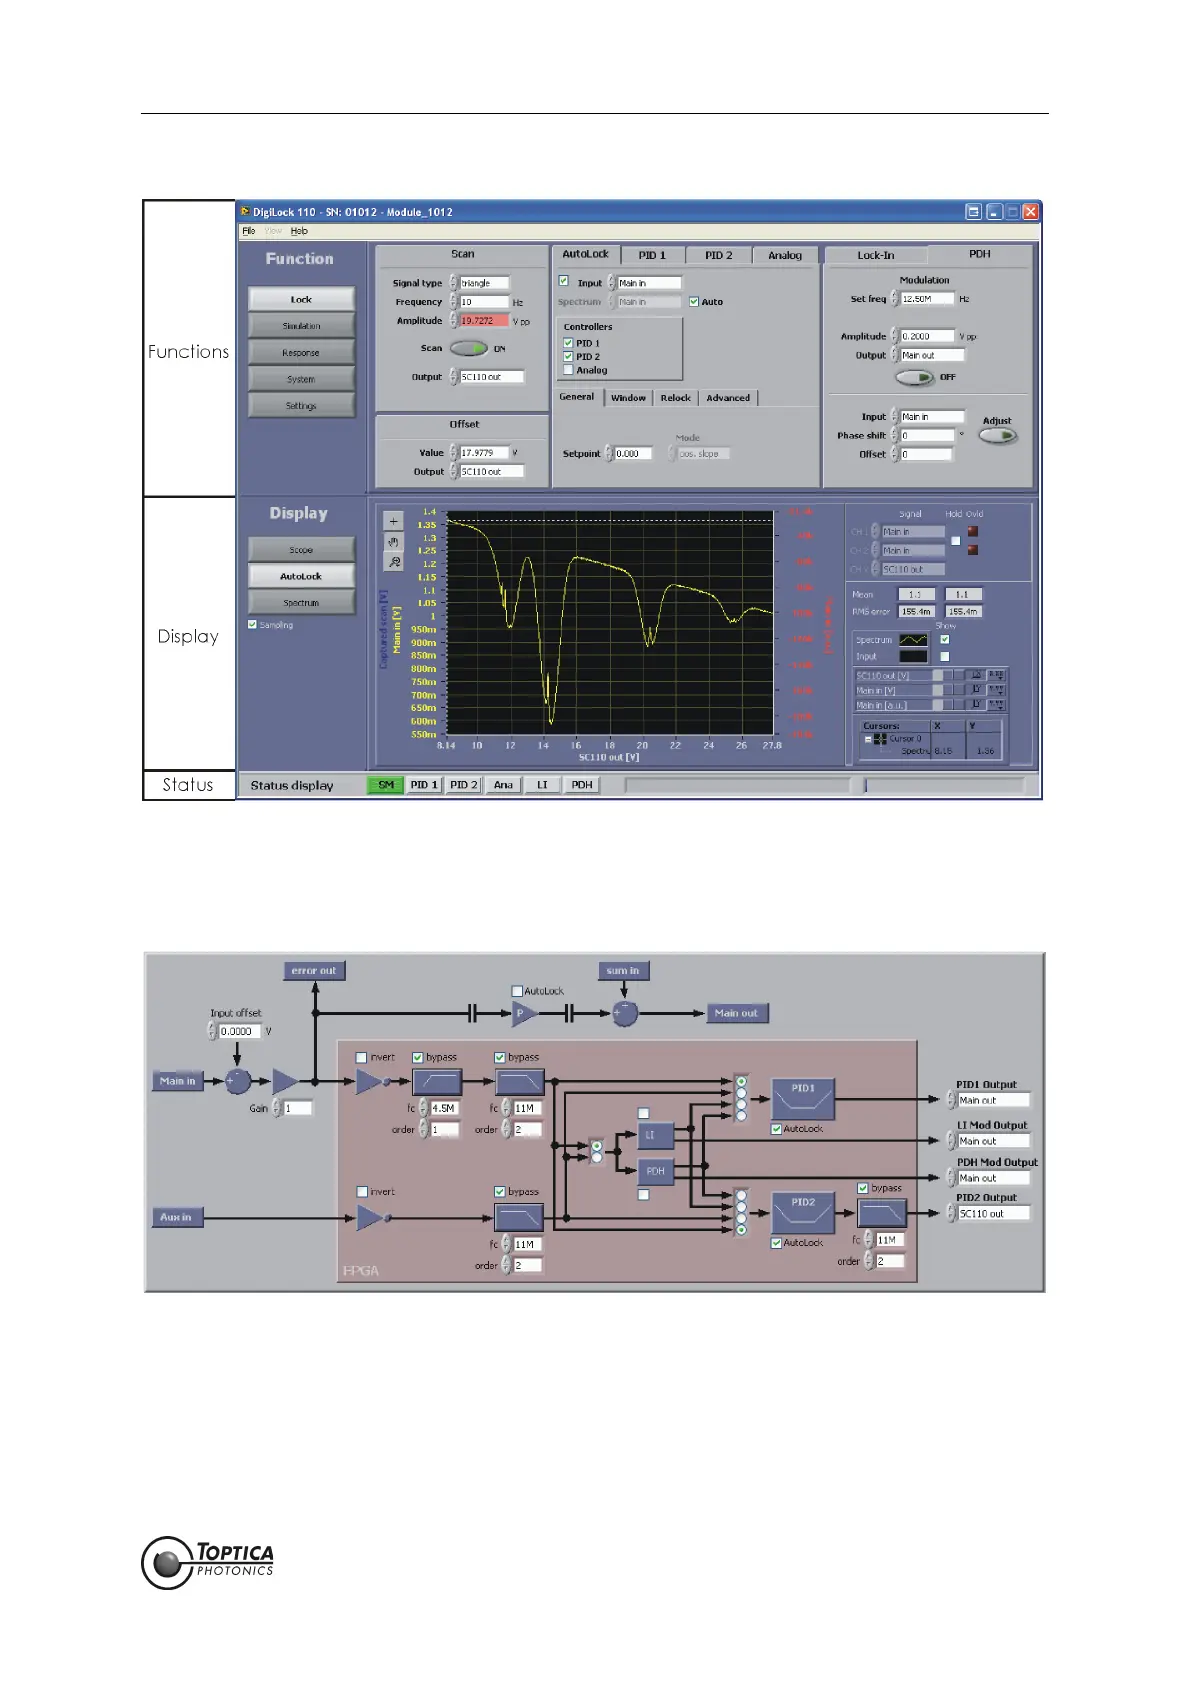
Figure 36 DigiLock user interface (DUI) after startup.
Here, the laser is scanned across the saturated absorption lines of Rb at 780.24 nm, see sec-
tion 10.2.
Figure 37 Graphical overview of the signal path through the controller (System function)
12. The System function (Figure 37) shows a block diagram of the control loop. Here several options for
the analog gain and offset as well as different filters for the <Main in> signal path can be set. Their
function and default setting are given in the following table. The default values are a good starting
point and can later be optimized for the specific application by the user. Please refer to section 9
for further information.
 Loading...