Feedback Controlyzer DigiLock 110
Page 58
Status: 5.12.17
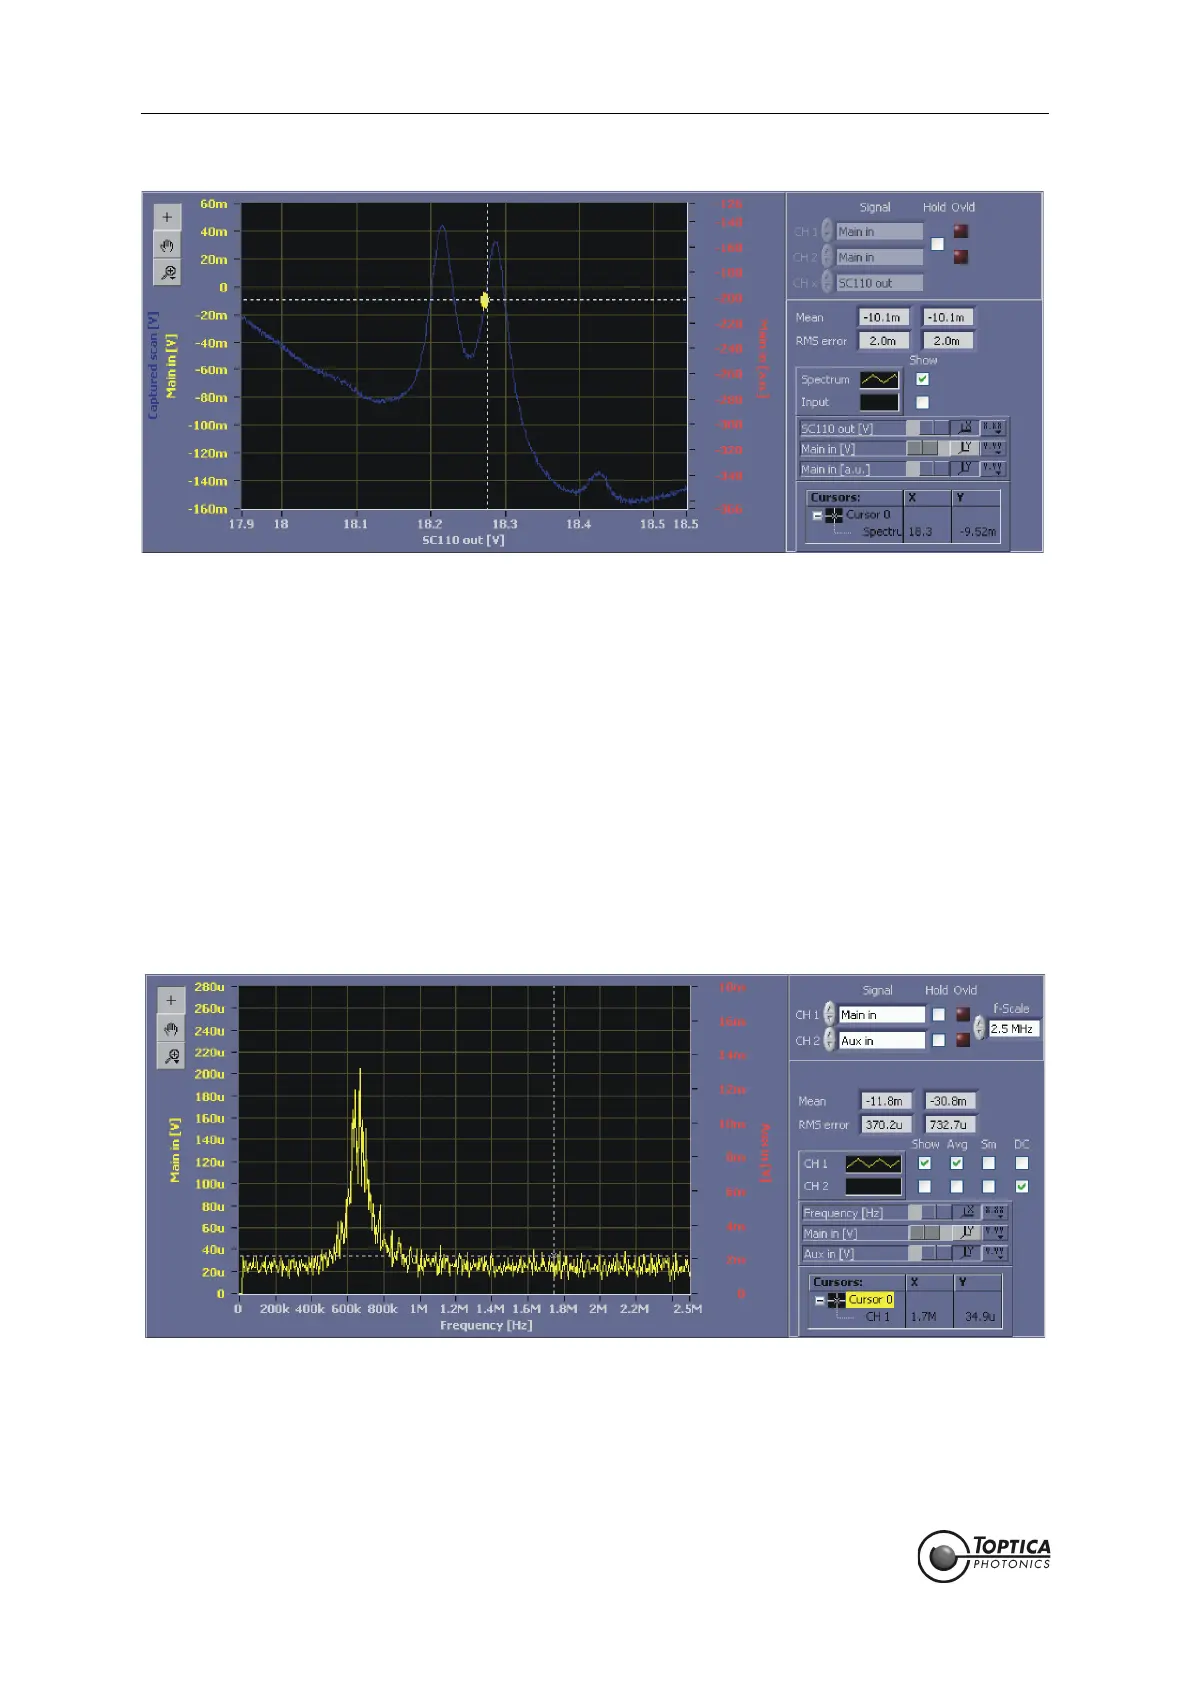
Figure 46 AutoLock display while the lock is active.
The yellow scatter plot indicates signal input and regulator output (PID 2)
Parameter optimization:
To obtain a “good“ lock it is necessary to increase the gain settings of the PID controllers to the highest
possible values without oscillations (see section 9 for details). The RMS error value in the right panel quan-
tifies the residual excursions of the laser. As PID 2 is only responsible for the low frequency components,
this controller can be left at moderate gains. The performance of the lock is predominantly determined
by the settings of PID 1 connected to the fast actuator (Mod input of the DLpro).
A helpful tool in the optimization process is the Spectrum display (see Figure 47). Here the result of the
Fourier transformation of the sampled time signal is shown. In our case select <Main in> as CH 1. The fre-
quency scale must be chosen according to the bandwidths of the experiment. Typical bandwidth of the
gratings are in the range of a few kHz while the DC modulation input has bandwidths of a few 100 kHz to
MHz. Turn off the DC component of CH 1 because normally a high DC offset dominates and therefore
small signal amplitudes may not be observed. Alternatively, the autoscale option can be deactivated
and an appropriate amplitude range chosen by setting the upper bound of the y-axis (see section 8.1)
to resolve all peaks in the frequency spectrum as desired.
Figure 47 Spectrum display of the photodiode signal at <Main in>
In this example the frequency analysis clearly shows the onset of an oscillation at about
650 kHz due to high gain settings.
To improve the lock performance you can now increase the gain of the I, P and D parts of the PID in turn
to values well below the point at which the control loop starts to oscillate. The general strategy for opti-
mizing the P, I and D parameters is described in section 9.3.
 Loading...