20
5 SETTING OF FUNCTIONS
20
SETTING OF FUNCTIONS
Chapter
5
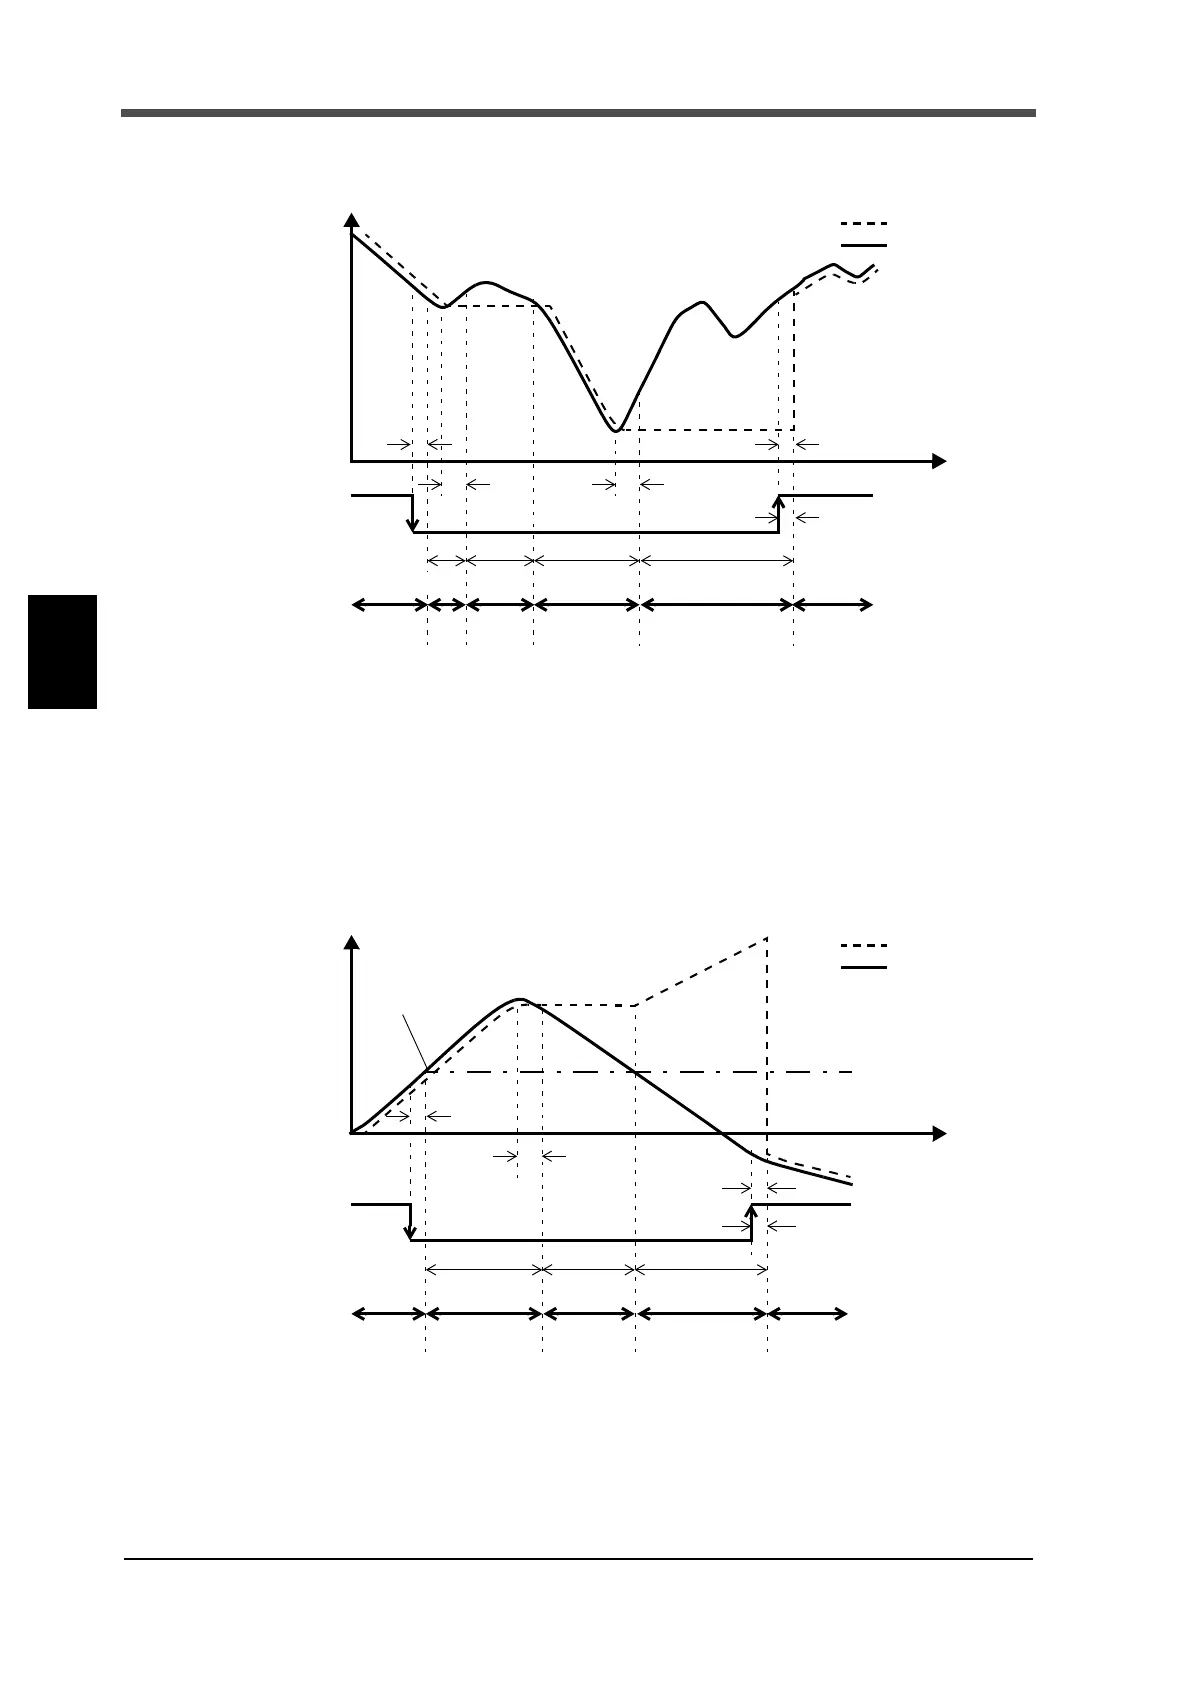
■Bottom (The minimum point is held.)
< Timing chart >
t1: Time from when the hold signal is inputted to when the indicated value is held
t2: Time from when the hold signal is cancelled to when the indicated value returns to tracking
t3: Minimum reset signal width required for canceling the hold
t4: Time after updating a hold value until it holds
* HOLD LED is blinked after HOLD start for the 1st time.
■P-P (The difference of the maximum point and the minimum point is held.)
< Timing chart >
t1: Time from when the hold signal is inputted to when the indicated value is held
t2: Time from when the hold signal is cancelled to when the indicated value returns to tracking
t3: Minimum reset signal width required for canceling the hold
t4: Time after updating a hold value until it holds
* HOLD LED is blinked after HOLD start for the 1st time.
Time
Indicated value
Sensor input value
HOLD
t2
t3
t4
t1
input
OFF
ON
t1 to t3: MAX 20mS
HOLD
LED
t4: Approx. 0.5s
t4
Detection
ON OFFOFF blinkingON
blinking
Hold
HoldDetection
Time
Indicated value
Sensor input value
HOLD
input
OFF
ON
t1 to t3: MAX 20mS
t3
Hold
blinking OFFOFF
HOLD
LED
Standard line
t2
t1
t4
t4: Approx. 0.5s
ON
blinking
DetectionDetection
Indicated value=0