Chapter 6. Solid-State NMR Experiments
101
VNMR 6.1C User Guide: Solid-State NMR 01-999162-00 C0402
Medek, A.; Harwood, J. S.; Frydman, L. J. Am. Chem. Soc. 1995, 117, 12779–12787.
Baltsberger, J. H.; Xu, Z.; Stebbins, J. F.; Wang, S. H.; Pines, A. J. Am. Chem. Soc.
1996.
Massiot, D.; Touzo, B.; Trumeau, D.; Coutures, J. P.; Virlet, J.; Florian, P.; Grandinetti,
P.J . Poster: 37th ENC and Solid State NMR 1996, 6, 73-84.
6.13 PASS1—2D Sideband Separation for CP/MAS
The PASS1 experiment produces a 2D plot with an isotropic spectrum in f1 and a MAS
sideband pattern in f2. There is negligible loss of signal intensity. Chemical shift tensor
components can be determined from the sideband intensities in f2. Figure 42 is a diagram
of the PASS1 sequence.
Applicability
PASS1 is available on
UNITY
INOVA and UNITYplus and present in userlib.
Macro
The macro pass1 converts a parameter set obtained with XPOLAR or XPOLAR1 for the
2D PASS experiment. Power levels and pulse widths are retained.
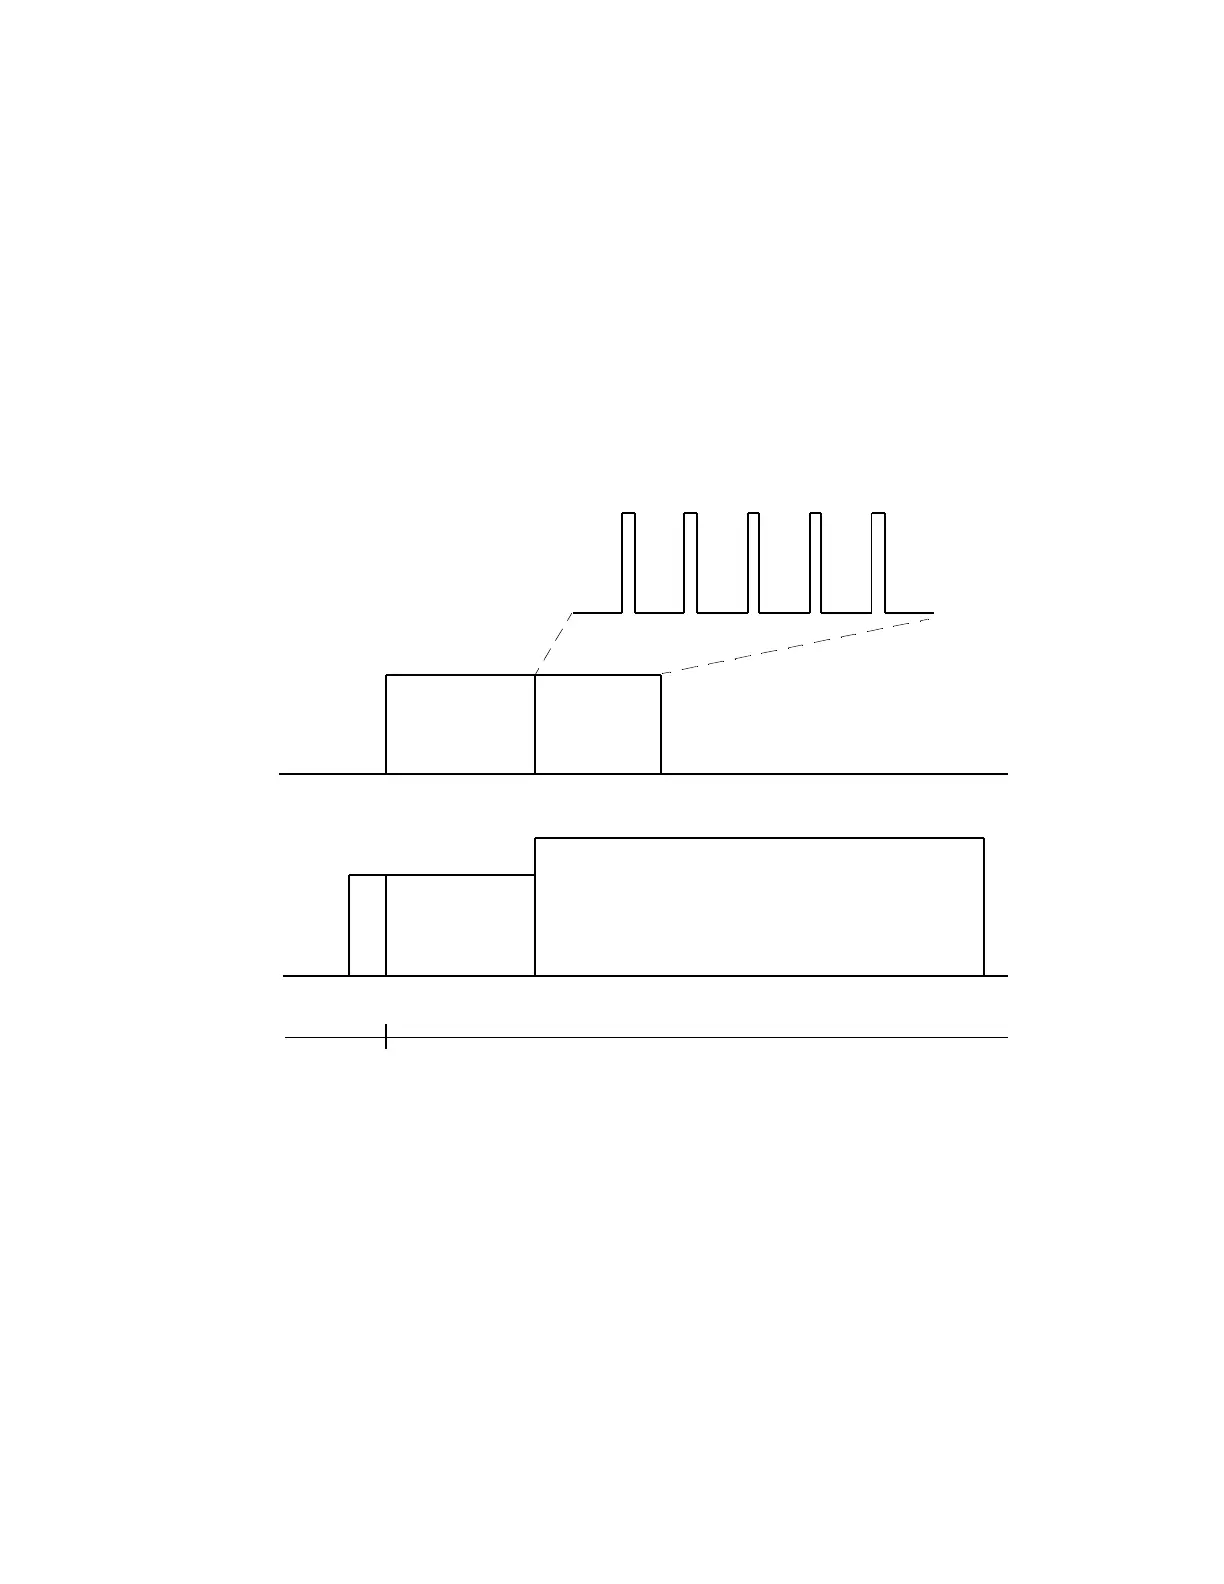
Figure 42. PASS1 Pulse Sequence
pw
cntct
cntct
(tpwrm)
(crossp)
(dipolr)
Tx
Dec
at
d1
AC
a1 a2 a3 a4 a5 a6
2*pwx2*pwx2*pwx2*pwx2*pwx
a(n)[m]
m=1 to ni
n= 1 to 6