Chapter 2. CP/MAS Solids Operation
31
VNMR 6.1C User Guide: Solid-State NMR 01-999162-00 C0402
4. Reconnect the observe (OBS) port of the probe to the observe channel on the magnet
leg.
5. Enter xpol='n' d1=1.0 nt=1 gain=4 ga.
6. Place the cursor near the D
2
O resonance and enter movetof.
7. Enter sw=5000 ga. Obtain another spectrum.
8. Enter gf acqi.
In the interactive acquisition mode select FID and within this mode select Spectrum.
9. Find the probe position for which changing the z1 shim will not affect the line
position.
a. Observe the spectrum, note the initial value of the Z1 shim and the initial
position of the probe (distance between the base of the magnet and the top of
the probe base or other convenient fixed reverence point).
b. Make a large positive change in the z1 shim.
The D
2
O resonance may move to positive or negative frequency.
c. If the D
2
O resonance does not move go to step h.
If the D
2
O resonance does move make note of the direction and continue with
step d.
d. Loosen the setscrews on the probe flange.
e. Change the height of the probe by a few millimeters (either up or down may
be necessary).
f. Tighten the setscrews and return z1 to the original value.
System Connector
INOVAcpmas J5311
MERCURYcpmas LO BAND Preamp (J5302) or FROM BB Probe (J6001)
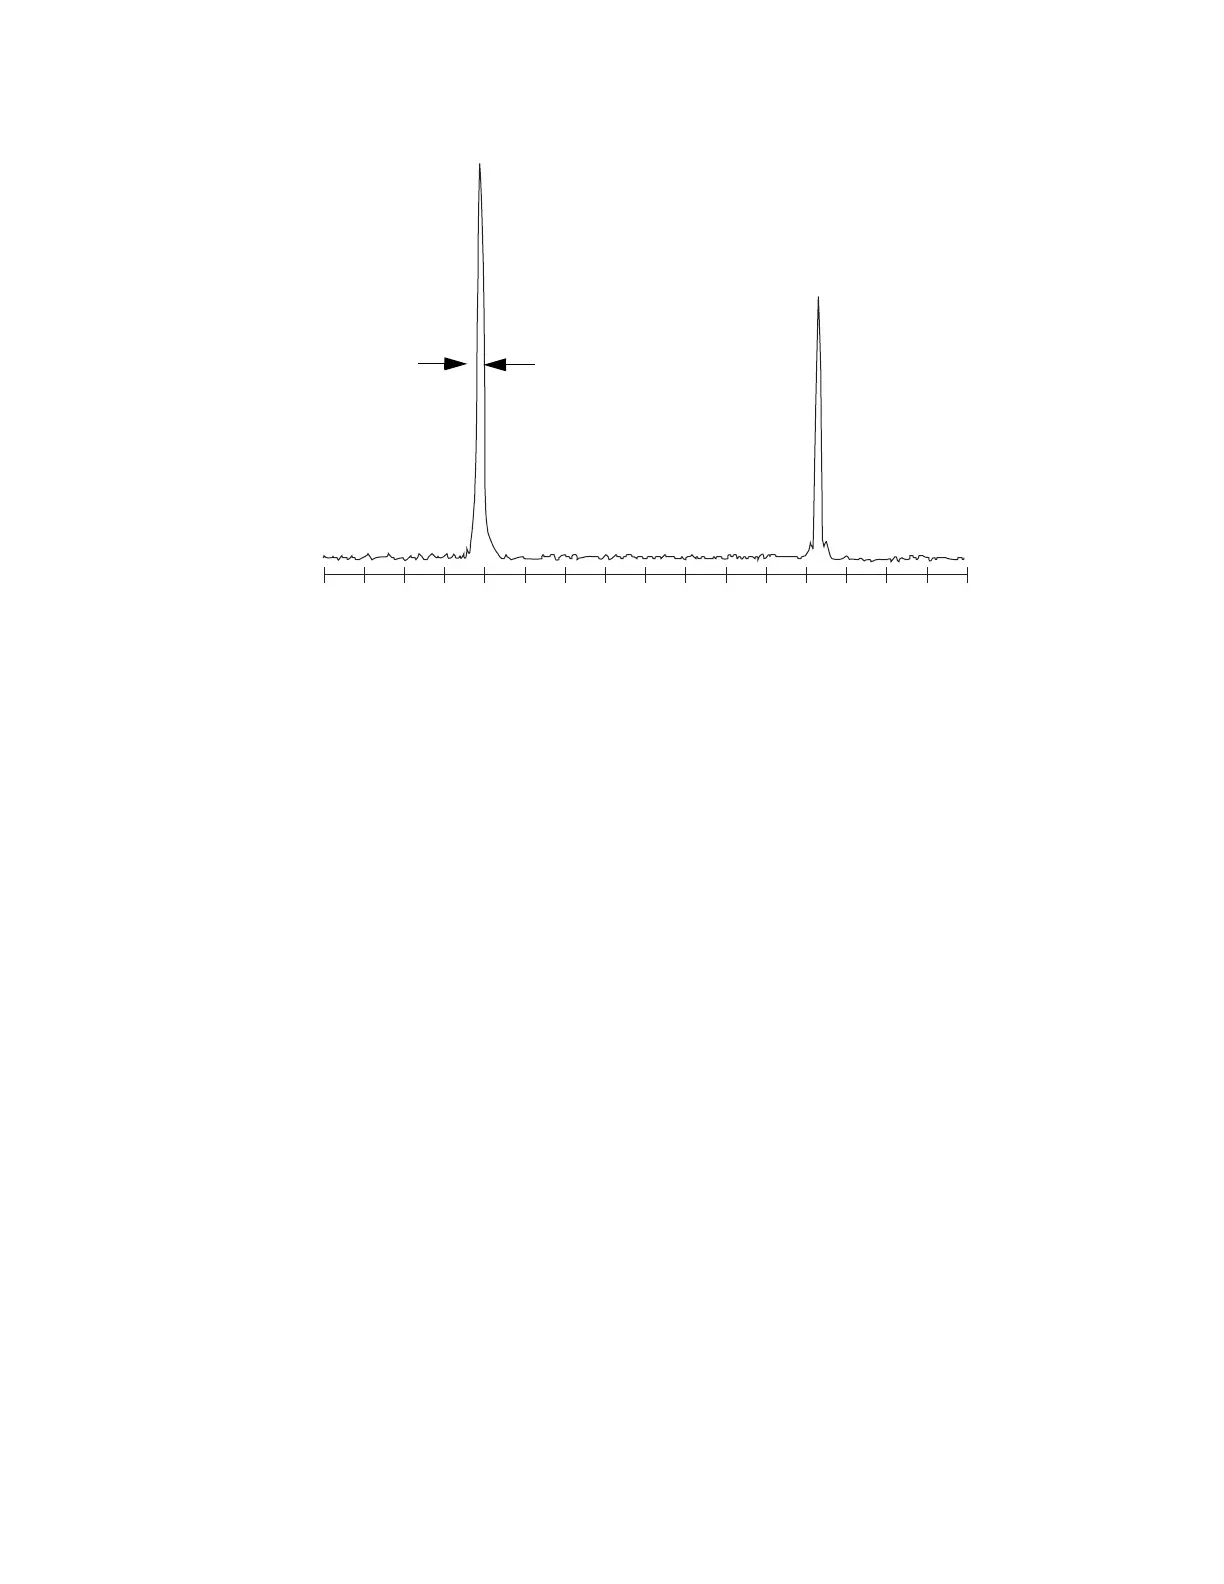
Figure 5. Typical MAS Spectrum of Adamantane
30
40
ppm
5.2 Hz at half height
lb = 1.0, at = 0.5