OTDR Series e-Manual, D07-00-076P-RevC00 Page 87 of 107
• The data at the bottom of the screen displays: Distance between markers A-B
• Loss between markers A-B in dB
• Attenuation between markers A-B
7.5.3.2 Two Point LSA (2-Pt LSA)
To increase the accuracy of a loss or attenuation measurement, a section of the trace
preceding and following the marker A and marker B can be approximated by a straight line. In
this mode, a Least Squares Approximation technique is used to determine the best intercept
values based on the marker positions. The length of these LSA sections is user selectable.
• Select LSA from drop-down list - An approximation line will appear on the screen
between markers. The data box at the bottom displays:
• Distance between marker A and B (km, miles, feet)
• Level difference in dB
• Attenuation based loss/distance
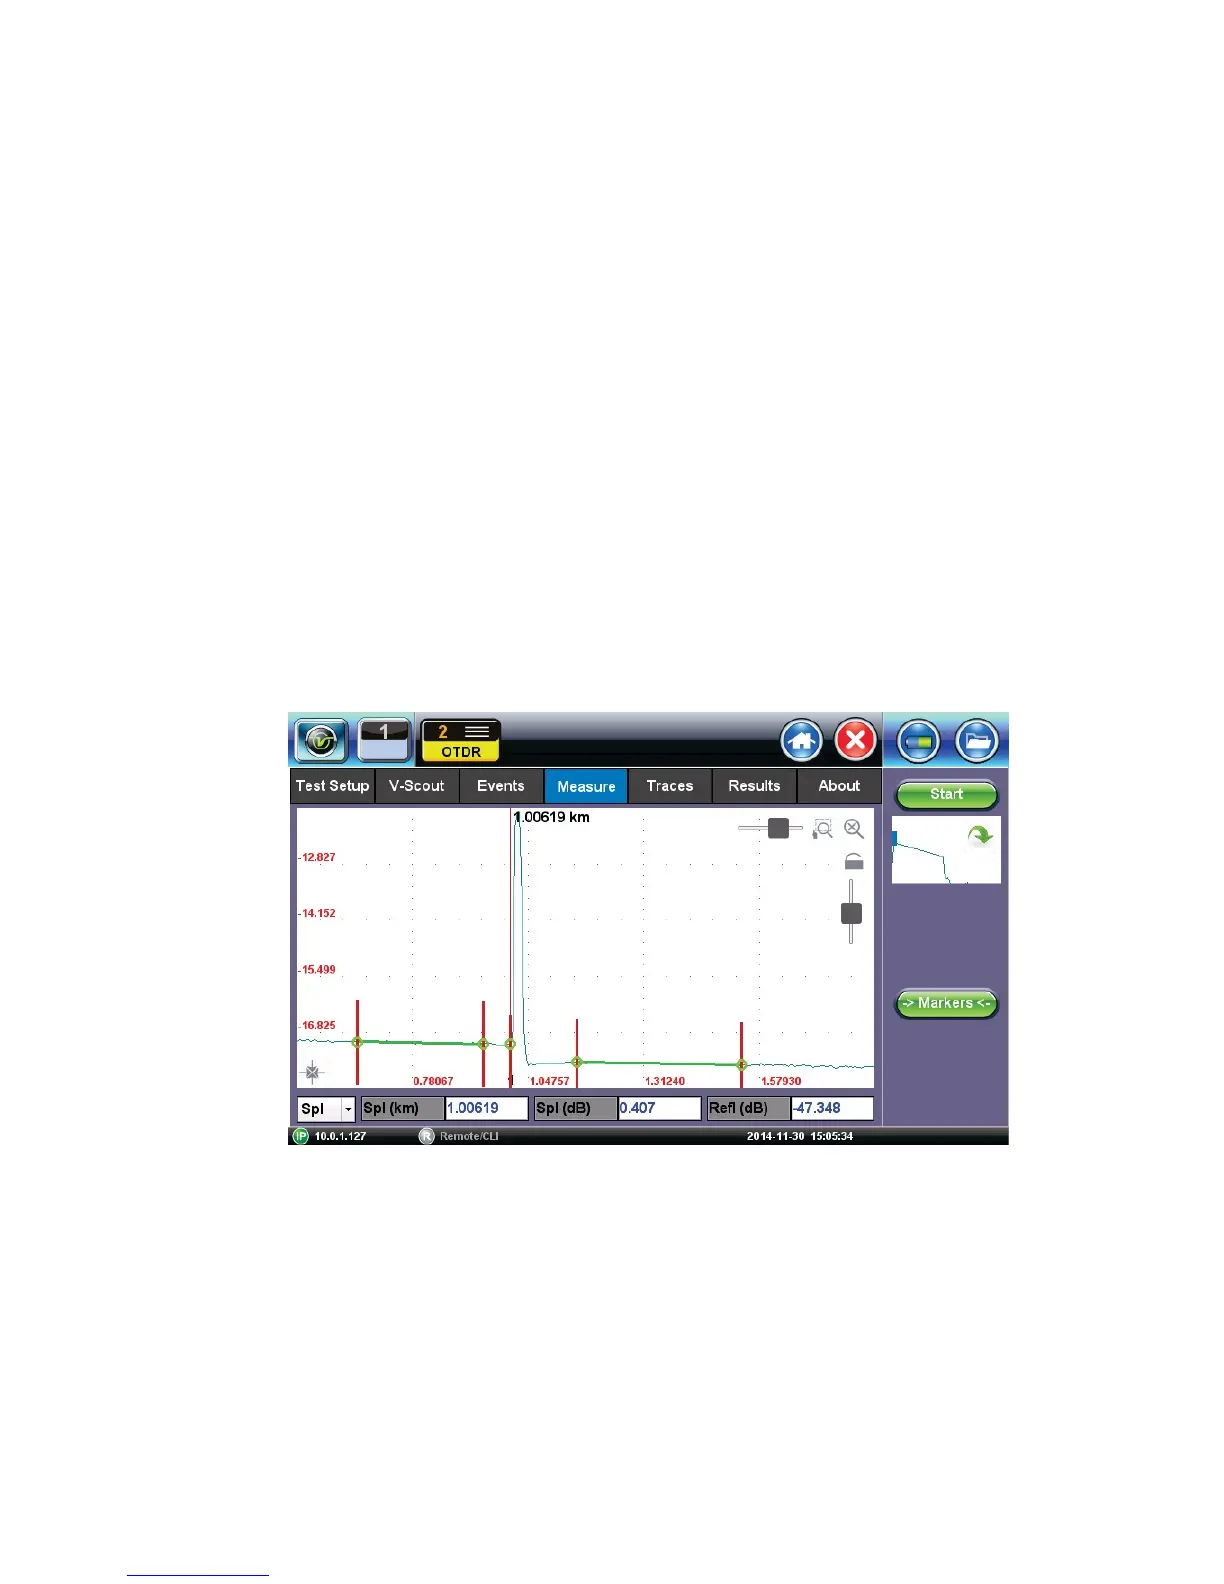
7.5.4 Splice Loss Measurement
Determines the Splice Loss in the optical fiber connection using the five markers method.
S
p
l
i
c
e
L
o
s
s
u
s
i
n
g
5
-
P
o
i
n
t
L
S
A
m
e
t
h
o
d
1. Select trace for measurement (if multiple traces are displayed on screen). The trace to be
measured can be selected using the green arrow in the trace overview window.
2. Select Splice (Spl) from drop-down list.
3. Expand or zoom the trace horizontally and vertically (using Zoom Controls) and position
event in the middle of the screen using the scroll function. Always ensure that a part of the
trace is visible on either side of the event so you can place markers properly.
4. Position center marker on the event’s rising or falling edge. You can use the rubber keypad
to place the marker exactly, if needed.