Vishay Micro-Measurements System 7000 Programmer’s Reference Manual
Page 27 of 142
Manual Recording Mode
You have several manual recording mode options. Notice these are performed on a card level
(not a group level).
Off- Disables manual recording on the card
SingleShot- Configures the card to record one reading when a start manual recording
command is received. (There is no need to send a Stop Manual recording command.)
Continuous - Configures the card to record continuously after the manual recording is
started until manual recording is stopped
Manual Recording “Pre-Record” Buffer Size
The System 7000 buffers a defined number of scans. You may specify that when you send
the “Start Manual Recording” command to the scanner you would also like to record some
number of scans that occurred just previously. You must specify the number of “pre-record”
scans that you would like have recorded. For example, you send the “Start Recording”
command based on some external signal. The scanner receives the command when scan N is
being processed. But you want to allow for some amount of lag time between the event that
generated the signal and the “Start Recording” command being sent, so you specify that you
would also like to record the 5 most previous scans. In this case you would also be recording
scans N-5, N-4, N-3, N-2, N-1, as well as N and so on.
If you'd like to think of acquiring XX number of seconds of "pre-trigger" data, use the
following formula to convert time into scans.
NumScans = ScanRate * Time
LabVIEW Configure Manual Recording VI
Active X ConfigureManualRecording method
Low-level Manual Recording Mode command
Set Pre-trigger Buffer Size for Manual Recording command
3.9.2.4 Configuring Limits Recording
Because of the flexibility of our limits recording, this section contains a lot of inter-dependent information.
There are examples at the end of the section that tie much of the material together.
How Limits Work
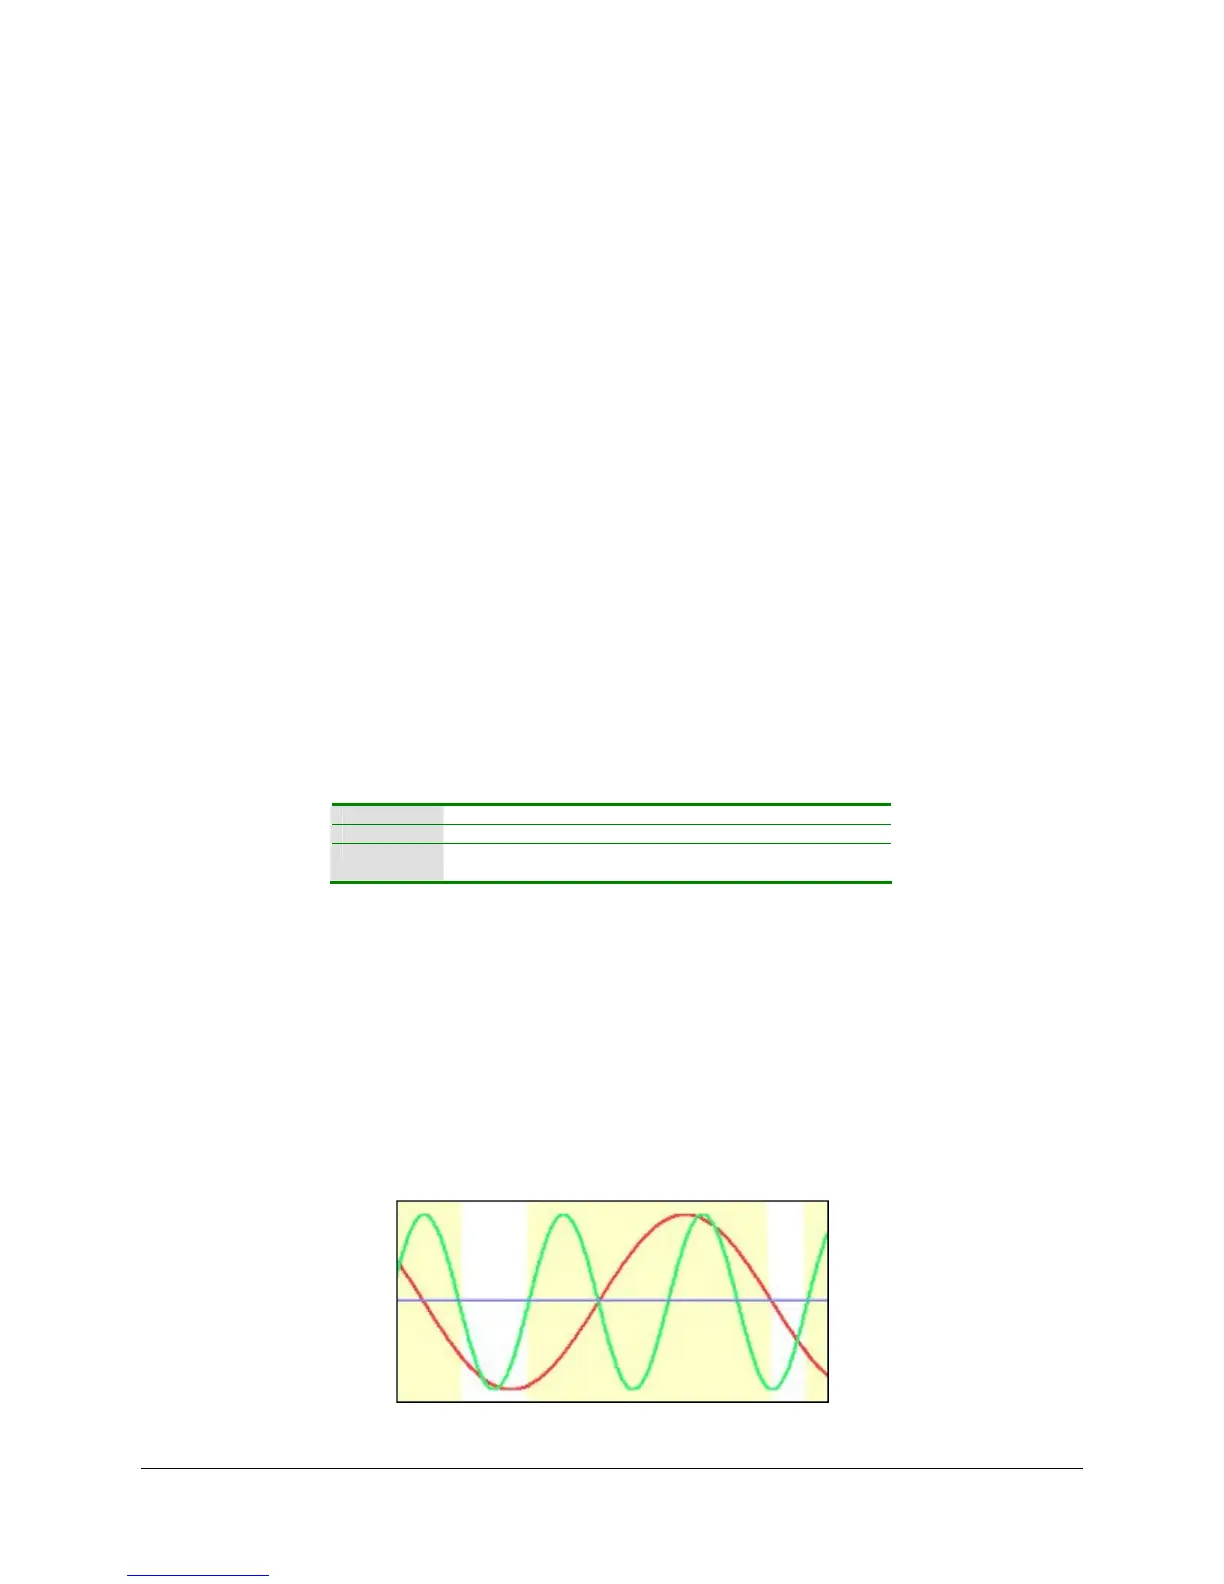
In the following two figures we will use two channels shown below as green and red traces on a
chart. A purple line through the middle of the chart will represent the threshold above which a
limit condition will satisfied for each channel. Anytime the channel’s trace is above the line that
channel can be said to have satisfied (or tripped) a limit condition.
Figure 4 – Limits
Figure 4 shows when limits are satisfied in yellow.
 Loading...