STP Overview 143
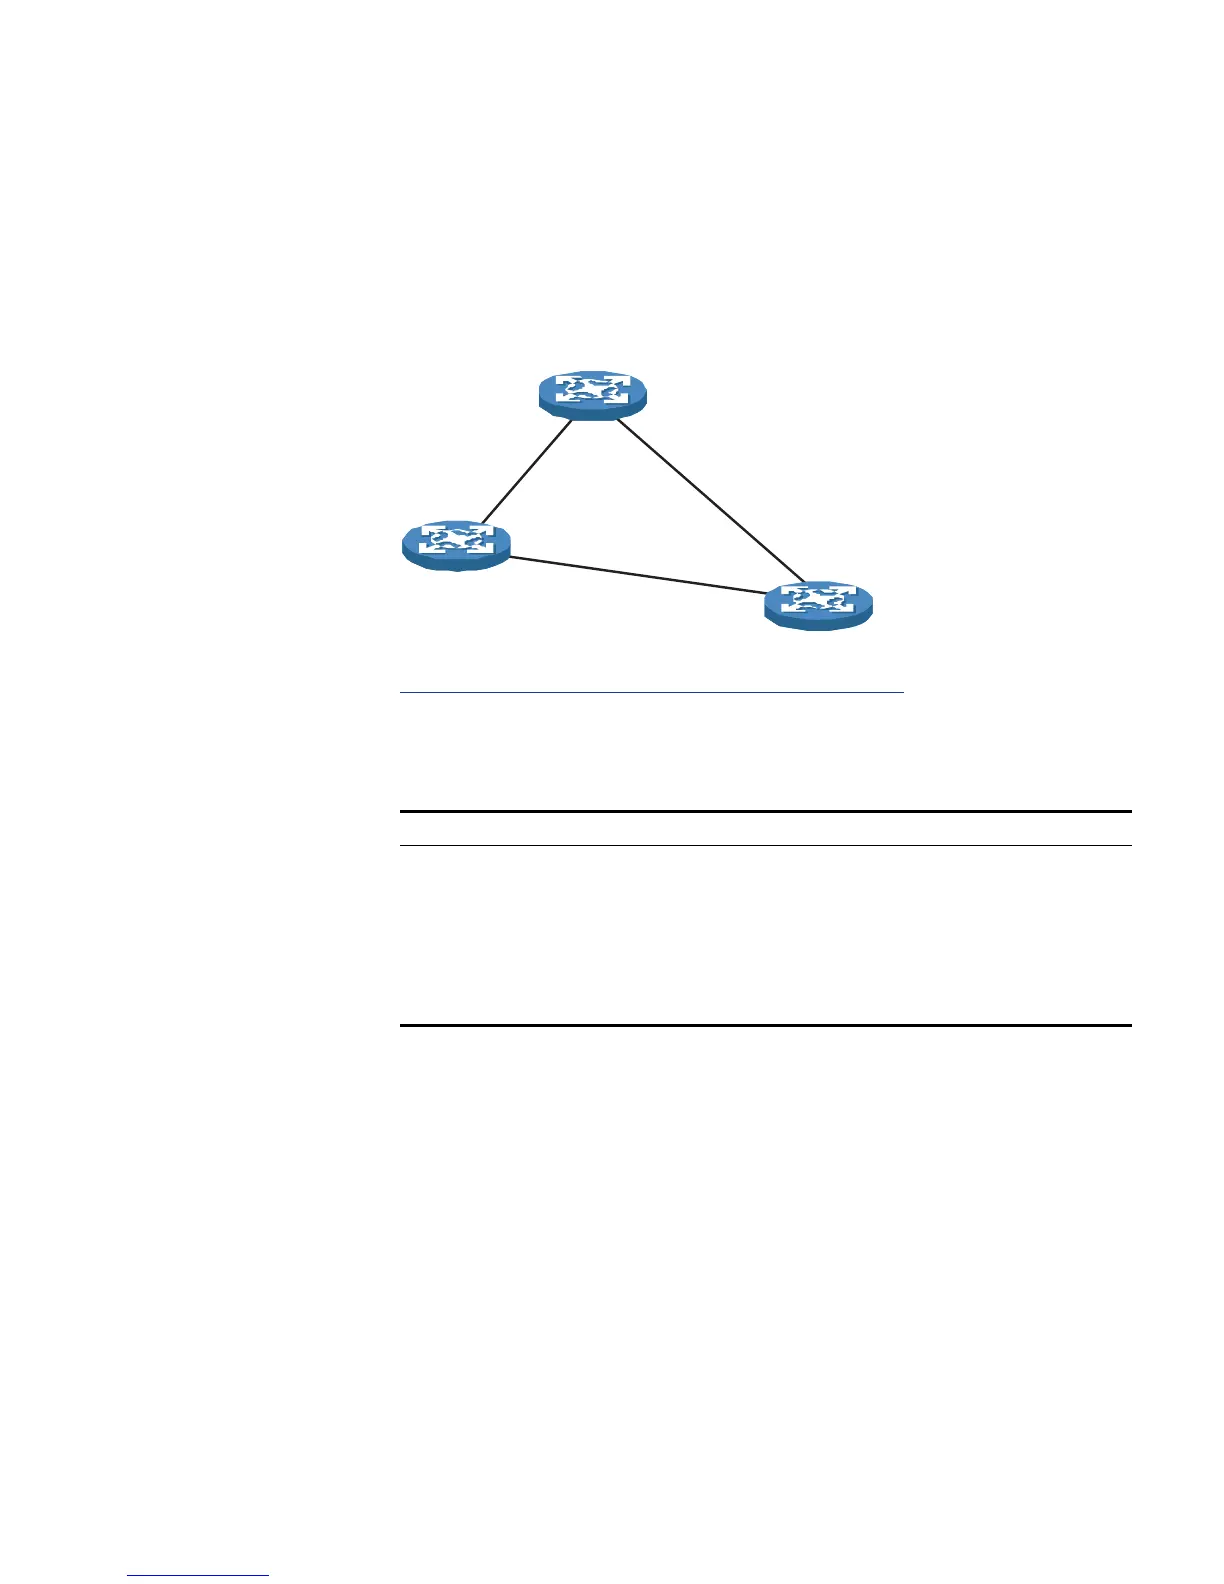
The following is an example of how the STP algorithm works. The specific
network diagram is shown in
Figure 47. The priority of Device A is 0, the
priority of Device B is 1, the priority of Device C is 2, and the path costs of these
links are 5, 10 and 4 respectively.
Figure 47 Network diagram for STP algorithm
■ Initial state of each device
The following table shows the initial state of each device.
■ Comparison process and result on each device
The following table shows the comparison process and result on each device.
Tab le 98 Initial state of each device
Device Port name BPDU of port
Device A AP1 {0, 0, 0, AP1}
AP2 {0, 0, 0, AP2}
Device B BP1 {1, 0, 1, BP1}
BP2 {1, 0, 1, BP2}
Device C CP1 {2, 0, 2, CP1}
CP2 {2, 0, 2, CP2}
AP 1 AP 2
Device A
With priority 0
Device B
Device C
BP 1
BP 2
CP 1
CP 2
5
10
4
With priority
1
With priority 2